

Subscribe to RSS
DOI: 10.3766/jaaa.19063
Comparison of Cortical Auditory Evoked Potential Findings in Presbycusis with Low and High Word Recognition Score
Authors
Address for correspondence
Publication History
Publication Date:
03 August 2020 (online)

Abstract
Background Deteriorated speech understanding is a common complaint in elderly people, and behavioral tests are used for routine clinical assessment of this problem. Cortical auditory evoked potentials (CAEPs) are frequently used for assessing speech detection and discrimination abilities of the elderly, and give promise for differential diagnosis of speech understanding problems.
Purpose The aim of the study was to compare the P1, N1, and P2 CAEP latencies and amplitudes in presbycusis with low and high word recognition score (WRS).
Research Design A cross-sectional study design was used forthe study. Two groups were formed from the patients with presbycusis based on their scores on the speech recognition test.
Study Sample Fifty-seven elderly volunteers participated in the study. The first group composed of 27 participants with high WRS, the other group composed of 30 participants with low WRS.
Data Collection and Analysis The CAEP waves were recorded from these participants using speech signals. Latencies and amplitudes of P1 -N1-P2 waves of the two groups were compared with the f-test statistic.
Results There were significant prolongation of P1 and N1 latencies in presbycusis with low WRS when compared with presbycusis with a relatively high word score (p < 0.05).
Conclusion According to the result of the research, P1 and N1 latencies of presbycusis with low WRS were longer than the participants with high WRS. Factors affecting peripheral auditory system, such as stimulus sensation level, might be responsible for P1 and N1 latency prolongation of the low WRS group.
Introduction
Problems with understanding speech have become common in the elderly. Increased age is usually accompanied by presbycusis with a prevalent pattern of a gradual loss of high-frequency sensitivity, which is necessary for speech perception. As a consequence, these problems become more frequent and severe as age increases (CHABA[5]; Humes[12]).
Understanding speech depends on the neural detection of time-varying cues of speech signals. There is a consensus that problems with understanding speech in the elderly is the result of deteriorated function of the cochlea and age-related declines in central auditory processing (Chisolm et al[3]; Mazelová et al[20]; Martin and Jerger[19]; Roth[28]).
Cortical auditory evoked potentials (CAEPs) are frequently used for exploring the effects of age and age-related changes in the central auditory system or assessing speech detection and discriminating the abilities of adults. These potentials are the voltage changes resulting from activation of the central auditory system with sound and reflect synchronous neural activity in the thalamocortical segment of central auditory system (Näätänen and Picton,[24]; Ostroff et al[27]; Schaul[30]). P1-N1-P2 waves are the most prominent components of CAEPs and they represent the neural detection of time-varying acoustic cues. Abnormal CAEP findings are attributed to impaired speech processing (Oates et al[26]; Tremblay et al[34]; Korczak et al[17]; Tremblay and Ross[35]).
In this study, it was aimed to compare central auditory system functions between patients with presbycusis with low and high word recognition scores (WRSs) by analyzing their CAEP latencies and amplitudes.
Determining a distinct latency or amplitude difference between these two groups may lead to the development of a complementary tool for the evaluation of patients' speech capability.
Materials and Methods
Participants
After receiving local ethics committee approval, 57 older patients (mean age = 73.7 years; range, 65-88 years) who were referred by the ear, nose, and throat department for pure-tone audiometry and word recognition tests were chosen for the study. All participants provided written informed consent. The inclusion criteria for the participants were that the pure-tone thresholds and medical histories of the volunteers should be in accordance with age-related hearing loss, hearing impaired participants had bilateral and symmetrical high-frequency sensorineural hearing loss, and hearing loss degree was lower than moderate according to Goodman's classification (Schlauch and Nelson[31]). To rule out any interfering deficiency, all participants had no significant otologic or neurologic medical history, they were not hearing aid users, and their Mini Mental Test scores were higher than 24.
Behavioral Tests
Pure-tone audiometry and word recognition tests were performed using an Astera 2 audiometer (Otometrics, Madsen, Denmark) via TDH 39 supra-aural headphones. Pure-tone thresholds of all participants were gathered at octaves from 250 to 8000 Hz for air conduction and 500 to 4000 Hz for bone conduction using the Hughson-Westlake procedure (Schlauch and Nelson[31]) using a 5-dB step size. Pure-tone averages (PTAs) were calculated by averaging the thresholds at 500, 1000, and 2000 Hz. The Dokuz Eylul Word Recognition Test (Durankaya et al[6]) was administered in silent conditions at the level of 40 dB above their speech reception threshold. For each participant, one list, including consonant-vowel-consonant-formatted 25 monosyllabic speech materials, was administered; correct answers were graded as “4,” and incorrect answers as “0.”
Composing Groups with Low and High WRSs
No norm value that defines a WRS, whether high or low, was encountered in the literature. To determine a norm value, the WRSs of participants were analyzed using summed scores and Z statistics (Luce and Krumhansl[18]; Messick[23]).
Equipment and Stimuli
CAEPs were collected using a HEARLab CAEP system (Frye Electronics, Tigard, OR) in response to speech stimuli comprising /g/ phoneme, which was extracted from a recording of running speech, spoken by a female speaker. The stimulus was 21-msec long, as illustrated in [Figure 1], and had its maximum energy peak at about 1250 Hz. This stimulus was available internally in the free field module of HEARLab. To introduce the stimuli monaurally, a custom-made digital attenuator incorporated in an amplifier and 3A insert earphone was used. Stimuli were presented at an interstimulus interval of 1,125 msec at 80-dB SPL (Golding et al[9]; Carter et al[2]).

Data Recording and Analysis
During the CAEP tests, the participants were seated in a recliner chair in a quiet room and encouraged to watch a DVD of a documentary film with the sound disabled to maintain their alertness. CAEPs were recorded with the electrodes attached at the vertex midline as positive, contralateral mastoid as negative, and forehead as ground. At least 100 epochs of each participant at a −200 to 600-msec-duration window were averaged. Cutoff frequencies of the band pass filter were set to 0.2 and 30 Hz for raw electroencephalograph signals, and the artifact rejection level was ± 150 μV.
Positive peaks occurring at about 50 msec, negative peaks occurring at about 80 to 100 msec, and positive peaks occurring at about 180 to 200 msec were assigned as P1, N1, and P2, respectively (Stapells[32]). The latency and amplitudes of the waves were identified as signing the top of the peak or the midpoint of broad peaks (Campbell and Sharma[1]). Response detection decisions were performed objectively using the automated statistical procedure (Hotelling's T2 statistic) on the HEARLab system (Golding et al[8]). All waveform peak points of participants were identified by the same researcher to eliminate interexaminer variations. The researcher was well experienced in measuring auditory evoked potentials. Two wave forms were recorded for each participant. Averaged wave latencies and amplitudes of the two wave forms for each P1, N1, and P2 waves were assigned as data of the research. Statistical analysis was performed using the Statistical Package for the Social Sciences for Windows, Version 22.0 software package (IBM Corp., Armonk, NY).
Results
A histogram of the distribution of PTA and WRS obtained from the test ear of the participants is shown in [Figure 2]. The number of WRS measurements was 57, the mean of the samples was 76.07%, and the median value was 76%. To determine a cutoff value concerning WRS, scale values were standardized, and analysis was performed with those values. A positive score diverged one SE of zero is widely used for evaluating abilities. The relative proficiency level was found at ≥0.25, which corresponds to ≥80% in terms of WRSs. The participants were divided into two groups according to this value. Participants with WRSs 80% and higher were assigned as the high word recognition score (HWRS) group and those with 76% and lower were considered as the low word recognition score (LWRS) group.

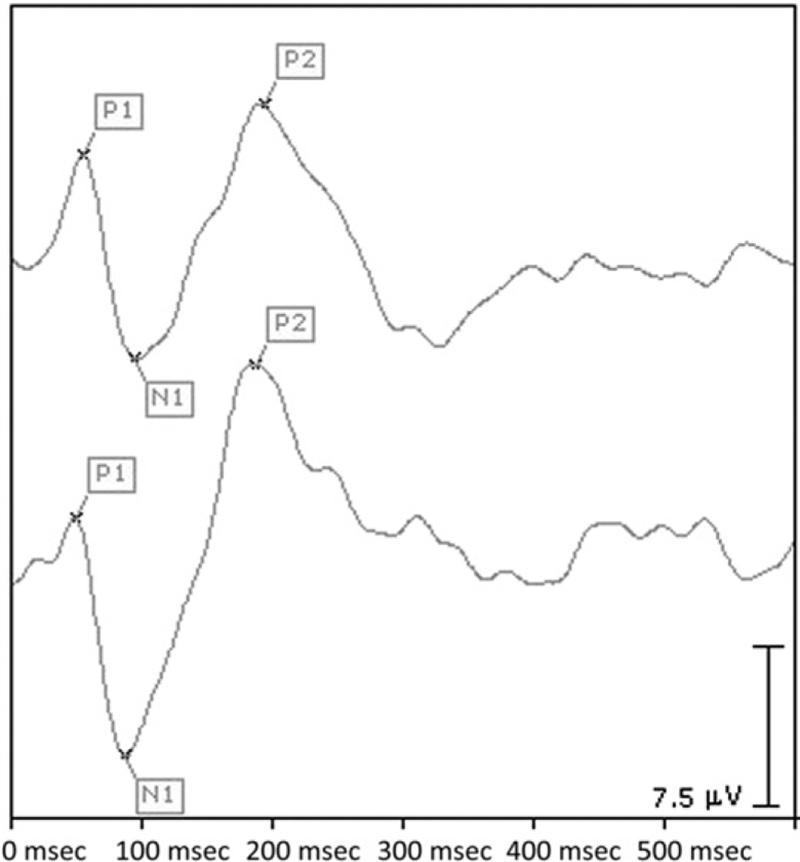
Pure-tone air conduction thresholds of the HWRS and LWRS groups for the octave frequencies from 250 to 8000 Hz and their ± 2 standard deviations (SDs) are shown in [Figure 3]. Typical waveform examples of CAEP components obtained from the HWRS and LWRS groups are shown in [Figure 4].

Skewness ofthe data showed that the distributions of the P1, N1, and P2 latency and amplitude values did not deviate distinctly from normal distribution, thus, parametric tests were used for statistical analyses ([Table 1]).
Unpaired t-tests were used to determine if there were latency or amplitude differences between the groups for CAEPs. A significant latency difference was found for P1 and N1 components. In other words, P1 and N1 latencies were found to be prolonged in the LWRS group compared with the HWRS group. No significant latency difference was found for P2, and no significant amplitude difference was found for P1, N1, and P2 amplitudes ([Table 2]).
|
Group |
N |
Mean |
SD |
t |
df |
Sig |
|
|---|---|---|---|---|---|---|---|
|
P1 latencies (msec) |
LWRS |
29 |
44.00 |
7.10 |
3.575 |
53 |
0.001[*] |
|
HWRS |
26 |
36.12 |
9.22 |
||||
|
N1 latencies (msec) |
LWRS |
30 |
97.10 |
8.71 |
2.676 |
55 |
0.010[*] |
|
HWRS |
27 |
90.74 |
9.22 |
||||
|
P2 latencies (msec) |
LWRS |
30 |
187.33 |
19.72 |
0.323 |
55 |
0.748 |
|
HWRS |
27 |
185.67 |
19.13 |
||||
|
P1 amplitudes (mV) |
LWRS |
29 |
2.76 |
2.23 |
0.942 |
55 |
0.351 |
|
HWRS |
26 |
2.24 |
1.92 |
||||
|
N1 amplitudes (mV) |
LWRS |
30 |
−6.34 |
2.72 |
0.33 |
55 |
0.974 |
|
HWRS |
27 |
−6.37 |
2.72 |
||||
|
P2 amplitudes (mV) |
LWRS |
30 |
4.74 |
2.02 |
−0.261 |
51 |
0.795 |
|
HWRS |
27 |
4.90 |
2.39 |
Note: *p < 0.05.
An effect size of P1 and N1 latencies is shown in [Table 3]. The importance level was determined on the basis of this classification (Cohen[4]; Ruscio and Mullen[29]):
-
0.2–0.5; small effect size
-
0.5–0.8; medium effect size
-
>0.8; large effect size.
|
Cohen's d |
Hedge's g |
|
|---|---|---|
|
P1 latency |
0.96 |
0.97 |
|
N1 latency |
0.71 |
0.71 |
In addition to P1, N1, and P2 responses, age and the PTAs of the groups were compared using the unpaired t-test. The mean PTA of the LWRS group was found to be higher than in the HWRS group; but there was no age difference found between the groups ([Table 4]).
|
Group |
N |
Mean |
SD |
t |
df |
Sig |
|
|---|---|---|---|---|---|---|---|
|
Age |
LWRS |
30 |
32.67 |
5.56 |
3.812 |
55 |
0.000 |
|
HWRS |
27 |
25.56 |
8.37 |
||||
|
PTA |
LWRS |
30 |
74.84 |
5.55 |
1.592 |
55 |
0.117 |
|
HWRS |
27 |
72.44 |
5.77 |
Discussion
We can simply classify the problem of patients with sensorineural hearing loss as decreased hearing sensitivity, which is relevant to the audibility of speech and distorted perception of speech when it is completely audible (McArdle and Hnath-Chisolm[21]). CAEP findings supply information about the two aspects of these problems of patients with sensorineural hearing loss. Signals derived from pure tones might be more convenient for the assessment of hearing sensitivity; however, in accordance with the aim of the study, we were more interested in problems with distorted perception of speech. It has been well documented that the temporal characteristics of CAEP signals become more important than the frequency characteristics when the subject of the study is patients with distorted perceptions of speech. In addition, in CAEP tests, speech stimuli are frequently used to study the neural representation of speech sounds in populations with impaired understanding of speech (Ostroff et al[27]; Tremblay et al[34]). Besides, three types of speech stimuli were available in the HEARLab CAEP system; brief speech signals derived from /m/, /g/, and /t/ phonemes (/s/ phoneme derivations are also available in the new version of the HEARLab CAEP system). /M/ speech stimulus has more energy at lower frequencies, /g/ has more energy in mid frequencies, and /t/ has more energy in high frequencies. These stimuli are complex signals, and both the temporal characteristic and frequency width of these stimuli are different from each other. In addition, crossover frequencies between these stimuli are uncertain; edge components of their frequency spectrum intersect with each other (National Acoustics Laboratories[25]). The temporal characteristic of a stimulus is very important, especially for CAEP testing. It has also been shown that abruptly starting speech stimuli have the potential for differentiating CAEPs of a hearing impaired group from a normal group (Tremblay et al[33]; Tremblay and Ross[35]). As a consequence, we focused on the temporal characteristic of a stimulus rather than its frequency components. In our opinion, a /g/ speech stimulus was appropriate for our purposes. This stimulus has two advantages; first, it is the shortest among the stimuli existing in the HEARLab system, and the period between the stimulus start time and its peak point is shorter than the others. Second, its frequency spectrum is completely or partially audible for patients with presbycusis with mild or lower degree hearing loss. The audibility of /m/ was higher than /g/, but the amplitude of this stimulus increases gradually to its peak point like the /t/ stimulus. The other handicap with the /t/ stimulus is that the audibility of its spectrum was lower than ‘‘g’' among the participants. As a consequence, the /g/ stimulus was assumed to be more sensitive for impairments affecting speech understanding rather than other stimuli existing in the HEARLab system.
Speech audiometry is accepted as the gold standard method for evaluating patients' speech understanding capability. Because some factors arising from the physician, patient, and speech material affect the validity of speech tests, complementary tests need to be administered for the verification of the test results (Egan[7]). In particular, electrophysiologic methods are sometimes more advantageous than audiometric test methods from the point of the fact that they substantially do not require active contribution from the patients. For that purpose, Kirkim et al[16] investigated the capability of middle latency responses for the differentiation of patients with presbycusis with relatively good and poor WRSs, and they found no significant difference between the two groups.
This study was carried out to reveal whether the latency and amplitudes of P1, N1, or P2 waves of patients with presbycusis with low and high speech recognition score differed from each other. The results demonstrate that the CAEP findings of patients with presbycusis with low WRSs differ in certain aspects from those with high WRSs; the P1 and N1 latencies of the LWRS group showed significant prolongation compared with the HWRS group with large and moderate effect size, respectively.
It is well documented that hearing sensitivity is the primary determinant of speech recognition performance in older patients with hearing loss. Central deficiencies that emerge with aging also account for speech understanding (Humes et al[15]; Humes and Roberts[14]; Humes and Christopherson[13]; Gordon Salant and Fitzgibbons[10]). These predictive factors for WRSs have effects on CAEP latencies. Several authors reported latency prolongation and amplitude increment of CAEP waves with increasing hearing thresholds or age (Harkrider et al[11]; McClannahan et al[22]). According to these studies, sound processing deficiencies and decreased neural inhibition occurring at the cortical level might account for latency prolongations and amplitude increments. These increments commonly occurred in the P2 wave, but in our study, we only found latency differences in P1 and N1 waves between the two groups. Stimulus audibility is another factor that is supposed to be responsible for latency prolongation. When we compared the HWRS and LWRS group depending on their age and PTA, we found no age difference between the two groups. On the other hand, a significant statistical PTA difference existed between the groups; the mean PTA of the LWRS group was higher than that of the HWRS group. This finding indicates that decreased hearing sensitivity might be a factor responsible for the prolongation of the P1 and N1 latencies of the LWRS group. It has already been demonstrated that higher stimulus intensity shortens CAEP latencies (Tremblay et al[33]; Campbell and Sharma[1]). The frequency spectrum of the /g/ stimulus overlaps with the frequencies used for pure-tone averaging (500–1000 and 2000 Hz). Thus, PTA values seem to be related to the stimulus sensation level. The PTA values of the HWRS group were lower than in the LWRS group; consequently, the speech stimulus sensation levels of the HWRS group were also lower than in the LWRS group. Therefore, the stimulus sensation level might be the basic factor for the P1 and N1 latency prolongation of the LWRS group.
This study was not designed to explore the individual effect of age, hearing loss, or stimulus sensation level on CAEP waves. Accordingly, future research is needed to explore the effect of each subfactor in presbycusis. It might be possible that the P1 and N1 latency difference between the LWRS and HWRS group would be more apparent by controlling these subfactors. Although we do not definitely know which subfactors were responsible for the P1 and N1 latency prolongation for the LWRS group, we know that the HWRS and LWRS groups differed with respect to P1 and N1 latencies. Nevertheless, the findings of this study show promise for the use of P1 and N1 latencies as an objective verification test for speech audiometry.
Conclusion
Speech audiometry tests that need the active contribution of patients might be inappropriate for those with cooperation problems, for whom objective complementary tests are needed for verification. CAEPs might be an option for this purpose because abnormal CAEP findings are attributed to impaired speech processing.
According to the results of this study, the P1 and N1 latencies of older participants with presbycusis with low speech recognition scores were significantly longer than in those with high speech recognition scores. Factors affecting the peripheral auditory system such as stimulus sensation level might be responsible for the P1 and N1 latency prolongation of the LWRS group.
These findings show promise for the use of P1 and N1 latencies as an objective verification test for speech audiometry. However, further studies are needed to support this conclusion.
Abbreviations
Conflict of Interest
None declared.
-
References
- 1 Campbell J, Sharma A. Compensatory changes in cortical resource allocation in adults with hearing loss. Front Syst Neurosci 2013; 7: 71
- 2 Carter L, Dillon H, Seymour J, Seeto M, Van Dun B. Cortical auditory-evoked potentials (CAEPs) in adults in response to filtered speech stimuli. J Am Acad Audiol 2013; 24 (09) 807-822
- 3 Chisolm TH, Willott JF, Lister JJ. The aging auditory system: anatomic and physiologic changes and implications for rehabilitation. Int J Audiol 2003; 42 (02) 2S3-10
- 4 Cohen J. Statistical Power Analysis for the Behavioral Sciences. New York, NY: Academic Press, Inc.; 1977
- 5 Committee on Hearing, Bioacoustics and Biomechanics (CHABA). Speech understanding and aging. J Acoust Soc Am 1988; 83: 859-893
- 6 Durankaya SM, Serbetcioglu M, Dalkilic G, Giirkan S, Kirkim G. Development of a Turkish monosyllabic word recognition test for adults. Int Adv Otol 2014; 10 (02) 172-180
- 7 Egan JJ. Basic aspects of speech audiometry. Ear Nose Throat J 1979; 58: 190-193
- 8 Golding M, Dillon H, Seymour J, Carter L. The detection of adult cortical auditory evoked potentials (CAEPs) using an automated statistic and visual detection. Int J Audiol 2009; 48 (12) 833-842
- 9 Golding M, Pearce W, Seymour J, Cooper A, Ching T, Dillon H. The relationship between obligatory cortical auditory evoked potentials (CAEPs) and functional measures in young infants. J Am Acad Audiol 2007; 18 (02) 117-125
- 10 Gordon Salant S, Fitzgibbons PJ. Temporal factors and speech recognition performance in young and elderly listeners. J Speech Hear Res 1993; 36: 1276-1285
- 11 Harkrider AW, Plyler PN, Hedrick MS. Effects of hearing loss and spectral shaping on identification and neural response patterns of stop-consonant stimuli in young adults. Ear Hear 2009; 30: 31-42
- 12 Humes LE. Speech understanding in the elderly. J Am Acad Audiol 1996; 7 (03) 161-167
- 13 Humes LE, Christopherson L. Speech identification difficulties of hearing-impaired elderly persons: the contributions of auditory-processing deficits. J Speech Hear Res 1991; 34: 686-693
- 14 Humes LE, Roberts L. Speech recognition difficulties of the hearing-impaired elderly: the contributions of audibility. J Speech Hear Res 1990; 33: 726-735
- 15 Humes LE, Watson BU, Christensen LA, Cokely CG, Halling DC, Lee L. Factors associated with individual differences in clinical measures of speech recognition among the elderly. J Speech Hear Res 1990; 37 (02) 465-474
- 16 Kirkim G, Madanoglu N, Akdas F, Serbetcioglu MB. Comparison of middle latency responses in presbycusis patients with two different speech recognition scores. Auris Nasus Larynx 2007; 34: 453-458
- 17 Korczak PA, Kurtzberg D, Stapells DR. Effects of sensorineural hearing loss and personal hearing AIDS on cortical event-related potential and behavioral measures of speech-sound processing. Ear Hear 2005; 26 (02) 165-185
- 18 Luce RD, Krumhansl CL. Measurement, scaling, and psychophysics. In: Atkinson RC, Hernstein RJ, Lindzey G, Luce RD. , ed. Stevens’ Handbook of Experimental Psychology: Perception and Motivation; Learning and Cognition. Vols. 1-2, 2nd ed. Oxford, England: John Wiley & Sons; 1988: 3-74
- 19 Martin JS, Jerger JF. Some effects of aging on central auditory processing. J Rehabil Res Dev 2005; 42 (04) (Suppl. 02) 25-44
- 20 Mazekrva J, Popelar J, Syka J. Auditory function in presbycusis: peripheral vs. central changes. Exp Gerontol 2003; 38 (1-2): 87-94
- 21 McArdle R, Hnath-Chisolm T. Speech audiometry. In: Katz J. , ed. Handbook ofClinical Audiology. 6th ed. Philadelphia, PA: Lippincott Williams & Wilkins; 2009: 64-79
- 22 McClannahan KS, Backer KC, Tremblay KL. Auditory evoked responses in older adults with normal hearing, untreated, and treated age-related hearing loss. Ear Hear 2019; 40 (05) 1106-1116
- 23 Messick S. Validity of psychological assessment: Validation of inferences from persons’ responses and performances as scientific inquiry into score meaning. Am Psychol 1995; 50 (09) 741-749
- 24 Näätänen R, Picton T. The N1 wave of the human electric and magnetic response to sound: a review and an analysis of the component structure. Psychophysiology 1987; 24 (04) 375-425
- 25 National Acoustics Laboratories. HEARLab System Operator’s Manual 2010. https://hearlab.nal.gov.au/wp-content/uploads/sites/3/2017/10/HEARLab-Manual.pdf . Accessed August 22, 2019
- 26 Oates PA, Kurtzberg D, Stapells DR. Effects of sensorineural hearing loss on cortical event-related potential and behavioral measures of speech-sound processing. Ear Hear 2002; 23 (05) 399-415
- 27 Ostroff JM, Martin BA, Boothroyd A. Cortical evoked response to acoustic change within a syllable. Ear Hear 1998; 19 (04) 290-297
- 28 Roth TN. Aging of the auditory system. Handb Clin Neurol 2015; 129: 357-373
- 29 Ruscio J, Mullen T. Confidence intervals for the probability of superiority effect size measure and the area under a receiver operating characteristic curve. Multivariate Behav Res 2012; 47 (02) 201-223
- 30 Schaul N. The fundamental neural mechanisms of electroencephalography. Electroencephalogr Clin Neurophysiol 1998; 106 (02) 101-107
- 31 Schlauch RS, Nelson P. Puretone evaluation. In: Katz J. , ed. Handbook of Clinical Audiology. 6th ed. Philadelphia, PA: Lippincott Williams & Wilkins; 2009: 30-49
- 32 Stapells DR. Cortical event related potentials to auditory stimuli. In: Katz J. , ed. Handbook of Clinical Audiology. 6th ed. Philadelphia, PA: Lippincott Williams & Wilkins; 2009: 395-430
- 33 Tremblay KL, Billings C, Rohila N. Speech evoked cortical potentials: effects of age and stimulus presentation rate. J Am Acad Audiol 2004; 15 (03) 226-237
- 34 Tremblay KL, Piskosz M, Souza P. Ostroff on the neural representation of speech cues. Clin Neurophysiol 2003; 114 (07) 1332-1343
- 35 Tremblay KL, Ross B. Effects of age and age-related hearing loss on the brain. J Commun Disord 2007; 40 (04) 305-312
Address for correspondence
-
References
- 1 Campbell J, Sharma A. Compensatory changes in cortical resource allocation in adults with hearing loss. Front Syst Neurosci 2013; 7: 71
- 2 Carter L, Dillon H, Seymour J, Seeto M, Van Dun B. Cortical auditory-evoked potentials (CAEPs) in adults in response to filtered speech stimuli. J Am Acad Audiol 2013; 24 (09) 807-822
- 3 Chisolm TH, Willott JF, Lister JJ. The aging auditory system: anatomic and physiologic changes and implications for rehabilitation. Int J Audiol 2003; 42 (02) 2S3-10
- 4 Cohen J. Statistical Power Analysis for the Behavioral Sciences. New York, NY: Academic Press, Inc.; 1977
- 5 Committee on Hearing, Bioacoustics and Biomechanics (CHABA). Speech understanding and aging. J Acoust Soc Am 1988; 83: 859-893
- 6 Durankaya SM, Serbetcioglu M, Dalkilic G, Giirkan S, Kirkim G. Development of a Turkish monosyllabic word recognition test for adults. Int Adv Otol 2014; 10 (02) 172-180
- 7 Egan JJ. Basic aspects of speech audiometry. Ear Nose Throat J 1979; 58: 190-193
- 8 Golding M, Dillon H, Seymour J, Carter L. The detection of adult cortical auditory evoked potentials (CAEPs) using an automated statistic and visual detection. Int J Audiol 2009; 48 (12) 833-842
- 9 Golding M, Pearce W, Seymour J, Cooper A, Ching T, Dillon H. The relationship between obligatory cortical auditory evoked potentials (CAEPs) and functional measures in young infants. J Am Acad Audiol 2007; 18 (02) 117-125
- 10 Gordon Salant S, Fitzgibbons PJ. Temporal factors and speech recognition performance in young and elderly listeners. J Speech Hear Res 1993; 36: 1276-1285
- 11 Harkrider AW, Plyler PN, Hedrick MS. Effects of hearing loss and spectral shaping on identification and neural response patterns of stop-consonant stimuli in young adults. Ear Hear 2009; 30: 31-42
- 12 Humes LE. Speech understanding in the elderly. J Am Acad Audiol 1996; 7 (03) 161-167
- 13 Humes LE, Christopherson L. Speech identification difficulties of hearing-impaired elderly persons: the contributions of auditory-processing deficits. J Speech Hear Res 1991; 34: 686-693
- 14 Humes LE, Roberts L. Speech recognition difficulties of the hearing-impaired elderly: the contributions of audibility. J Speech Hear Res 1990; 33: 726-735
- 15 Humes LE, Watson BU, Christensen LA, Cokely CG, Halling DC, Lee L. Factors associated with individual differences in clinical measures of speech recognition among the elderly. J Speech Hear Res 1990; 37 (02) 465-474
- 16 Kirkim G, Madanoglu N, Akdas F, Serbetcioglu MB. Comparison of middle latency responses in presbycusis patients with two different speech recognition scores. Auris Nasus Larynx 2007; 34: 453-458
- 17 Korczak PA, Kurtzberg D, Stapells DR. Effects of sensorineural hearing loss and personal hearing AIDS on cortical event-related potential and behavioral measures of speech-sound processing. Ear Hear 2005; 26 (02) 165-185
- 18 Luce RD, Krumhansl CL. Measurement, scaling, and psychophysics. In: Atkinson RC, Hernstein RJ, Lindzey G, Luce RD. , ed. Stevens’ Handbook of Experimental Psychology: Perception and Motivation; Learning and Cognition. Vols. 1-2, 2nd ed. Oxford, England: John Wiley & Sons; 1988: 3-74
- 19 Martin JS, Jerger JF. Some effects of aging on central auditory processing. J Rehabil Res Dev 2005; 42 (04) (Suppl. 02) 25-44
- 20 Mazekrva J, Popelar J, Syka J. Auditory function in presbycusis: peripheral vs. central changes. Exp Gerontol 2003; 38 (1-2): 87-94
- 21 McArdle R, Hnath-Chisolm T. Speech audiometry. In: Katz J. , ed. Handbook ofClinical Audiology. 6th ed. Philadelphia, PA: Lippincott Williams & Wilkins; 2009: 64-79
- 22 McClannahan KS, Backer KC, Tremblay KL. Auditory evoked responses in older adults with normal hearing, untreated, and treated age-related hearing loss. Ear Hear 2019; 40 (05) 1106-1116
- 23 Messick S. Validity of psychological assessment: Validation of inferences from persons’ responses and performances as scientific inquiry into score meaning. Am Psychol 1995; 50 (09) 741-749
- 24 Näätänen R, Picton T. The N1 wave of the human electric and magnetic response to sound: a review and an analysis of the component structure. Psychophysiology 1987; 24 (04) 375-425
- 25 National Acoustics Laboratories. HEARLab System Operator’s Manual 2010. https://hearlab.nal.gov.au/wp-content/uploads/sites/3/2017/10/HEARLab-Manual.pdf . Accessed August 22, 2019
- 26 Oates PA, Kurtzberg D, Stapells DR. Effects of sensorineural hearing loss on cortical event-related potential and behavioral measures of speech-sound processing. Ear Hear 2002; 23 (05) 399-415
- 27 Ostroff JM, Martin BA, Boothroyd A. Cortical evoked response to acoustic change within a syllable. Ear Hear 1998; 19 (04) 290-297
- 28 Roth TN. Aging of the auditory system. Handb Clin Neurol 2015; 129: 357-373
- 29 Ruscio J, Mullen T. Confidence intervals for the probability of superiority effect size measure and the area under a receiver operating characteristic curve. Multivariate Behav Res 2012; 47 (02) 201-223
- 30 Schaul N. The fundamental neural mechanisms of electroencephalography. Electroencephalogr Clin Neurophysiol 1998; 106 (02) 101-107
- 31 Schlauch RS, Nelson P. Puretone evaluation. In: Katz J. , ed. Handbook of Clinical Audiology. 6th ed. Philadelphia, PA: Lippincott Williams & Wilkins; 2009: 30-49
- 32 Stapells DR. Cortical event related potentials to auditory stimuli. In: Katz J. , ed. Handbook of Clinical Audiology. 6th ed. Philadelphia, PA: Lippincott Williams & Wilkins; 2009: 395-430
- 33 Tremblay KL, Billings C, Rohila N. Speech evoked cortical potentials: effects of age and stimulus presentation rate. J Am Acad Audiol 2004; 15 (03) 226-237
- 34 Tremblay KL, Piskosz M, Souza P. Ostroff on the neural representation of speech cues. Clin Neurophysiol 2003; 114 (07) 1332-1343
- 35 Tremblay KL, Ross B. Effects of age and age-related hearing loss on the brain. J Commun Disord 2007; 40 (04) 305-312