

Subscribe to RSS
DOI: 10.1055/s-0041-1728757
Leveraging Artificial Intelligence to Improve Chronic Disease Care: Methods and Application to Pharmacotherapy Decision Support for Type-2 Diabetes Mellitus
Authors
Funding This work was supported by Hitachi, Ltd.
Abstract
Objectives Artificial intelligence (AI), including predictive analytics, has great potential to improve the care of common chronic conditions with high morbidity and mortality. However, there are still many challenges to achieving this vision. The goal of this project was to develop and apply methods for enhancing chronic disease care using AI.
Methods Using a dataset of 27,904 patients with diabetes, an analytical method was developed and validated for generating a treatment pathway graph which consists of models that predict the likelihood of alternate treatment strategies achieving care goals. An AI-driven clinical decision support system (CDSS) integrated with the electronic health record (EHR) was developed by encapsulating the prediction models in an OpenCDS Web service module and delivering the model outputs through a SMART on FHIR (Substitutable Medical Applications and Reusable Technologies on Fast Healthcare Interoperability Resources) web-based dashboard. This CDSS enables clinicians and patients to review relevant patient parameters, select treatment goals, and review alternate treatment strategies based on prediction results.
Results The proposed analytical method outperformed previous machine-learning algorithms on prediction accuracy. The CDSS was successfully integrated with the Epic EHR at the University of Utah.
Conclusion A predictive analytics-based CDSS was developed and successfully integrated with the EHR through standards-based interoperability frameworks. The approach used could potentially be applied to many other chronic conditions to bring AI-driven CDSS to the point of care.
Keywords
artificial intelligence - clinical decision support system - health information technology - disease management - chronic diseaseIntroduction
Predictive modeling and artificial intelligence (AI) have great potential to improve care in a wide range of clinical areas[1] [2] [3] including diagnosis,[3] [4] [5] [6] risk assessment,[7] [8] [9] lifestyle management,[10] and home monitoring.[11] [12] Such AI-driven approaches to improving care could have significant impact if applied effectively in the care of common chronic diseases with high morbidity and mortality such as diabetes mellitus.[13] In particular, clinical decision support (CDS) is a promising approach to informing the care of chronic conditions leveraging AI.[14] [15] [16] Indeed, machine learning (ML)-based CDS tools have been explored for providing pharmacotherapy recommendations[17] [18] and predicting the risk of complications[19] [20] in the context of chronic disease. Interoperability standards have also been explored as a means to facilitate the dissemination of CDS tools for common chronic diseases,[21] including for providing AI-driven care recommendations.
Despite its great promise, AI-based CDS for improving the care of chronic diseases, especially for the purpose of treatment selection support, is still in early stages. At least two important challenges must be overcome to fulfill this promise.
The first challenge is accurate and robust prediction of expected treatment outcomes based on real world data. Despite their successful application in other clinical areas, ML algorithms such as Random Forest[22] (RF) and Gradient Boosting Tree[23] (GBT) can lead to biased estimations in the context of predicting treatment outcomes.[24] Also, ML approaches are able to learn only the patterns encountered in the training dataset. Thus, models produced using ML approaches may give rise to unexpected results in new clinical contexts and may therefore be unacceptable to clinicians practicing in those settings.
A second important challenge is integrating the AI-driven CDS into clinical workflows. Even when underlying components such as predictive models are effective and accurate, an AI-driven clinical decision support system (CDSS) may not be suitable for use in busy clinical settings unless they are efficiently integrated with clinical workflows. This integration with clinical workflows and the electronic health record (EHR) should ideally use a technical architecture that enables deployment at scale.
Objectives
This paper proposes AI-driven CDS methods for chronic disease management to help clinicians select treatment strategies more rationally and with confidence during their workflow. This paper makes the following contributions:
-
We propose a novel prediction method, Treatment Pathway Graph (TPG)-based Estimation (TPGE), in which a TPG is used to predict the likelihood of alternate treatment strategies achieving care goals. Our approach outperforms baseline ML models in treatment outcome prediction tasks in the context of real world EHR datasets.
-
We describe a standards-based approach to integrating predictive models with the EHR using widely adopted interoperability standards and open-source tools. This EHR-integrated CDSS facilitates shared decision making by clinicians and patients as they decide on an optimal treatment strategy that considers predictive modeling results in conjunction with other relevant data such as costs and side-effect profiles.
In this study, we selected type-2 diabetes mellitus (T2DM) as the target disease due to its significant morbidity and mortality as well as the trial-and-error nature of the current standard of care as it relates to pharmacotherapy. The established clinical guideline in this area—the American Diabetes Association (ADA)'s Standards of Medical Care in Diabetes [25]—provides evidence-based guidance for pharmacotherapy regimens.[26] [27] However, about half of patients with T2DM are unable to achieve the treatment target of controlling hemoglobin A1c (HbA1c) levels to less than 7%,[25] [28] due to the lack of adherence of patients,[25] [29] clinical inertia,[29] [30] [31] [32] [33] and a trial-and-error approach to treatment selection.[26] [27] Our goal was to develop an EHR-integrated CDSS that overcomes the challenges described above and supports personalized, AI-supported pharmacotherapy for T2DM.
Methods
In this study, we developed a novel approach to predictive modeling, applied this TPGE approach to develop predictive models for T2DM treatment outcomes, evaluated the performance of these models, and integrated them with the EHR using a standards-based and user-centered approach. The methods used are described below. This study was approved by the Institutional Review Boards of both the University of Utah and the Research & Development Group of Hitachi, Ltd.
Treatment Pathway Graph-Based Estimation
Recently, Metalearners have been proposed as a framework to estimate conditional average treatment effects using ML.[34] One Metalearners approach known as T-learner estimates the conditional expectations of the outcomes separately for units under control and those under treatment, then it takes the differences between them as conditional average treatment effects. The outcome estimations are conducted by two ML models independently constructed from the data of treatment group and the control group, respectively. This contrasts with other ML-based approaches, such as Causal Tree,[35] which build a single model from combined treatment and control data to predict an expected effect. This feature of T-learner enables it to predict two types of outcomes for the control group and treatment group simultaneously. Based on the idea of T-learner, we propose TPGE to predict multiarm treatment outcomes for treatment selection.
The key idea is to construct a TPG representing the treatment transition structure from real world data and to construct prediction models stratified by the transitions of the graph. The structure of the graph can provide possible treatment strategies for a patient empirically. Each prediction model can estimate the treatment outcome for a treatment transition. Also, each model can predict the impact of concurrent weight loss on the treatment outcome. TPGE method consists of three processes: data shaping, graph construction, and model construction.
Data Shaping
This process generates analytics-ready vector data from accumulated EHR records to construct the graph and models. Each vector data corresponds to one case and contains treatment types, HbA1c levels before and after treatment changes, and other relevant information.
To start, records are extracted for patients with two or more HbA1c measurements. Second, sets of vectors consisting of the baseline and posterior HbA1c values are constructed for every patient. The two HbA1c measurements must have occurred within 90 ± 30 days for 3-month predictions and within 180 ± 30 days for 6-month prediction since T2DM patients are generally followed up every 3 to 6 months. Third, three types of medication information are extracted for each HbA1c pair: proportion of days covered for originally prescribed drugs (PDC-OPDs), proportion of days covered for newly prescribed drugs (PDC-NPDs), and total days covered for drugs prescribed in the past (TDC-PPDs). PDC-OPD is the proportion of days covered (PDC) by diabetes medications in 90 days before the baseline HbA1c measurement. PDC-NPD is the PDC by diabetes medications between the baseline and the posterior HbA1c measurements. TDC-PPD is the total prescription days of diabetes medications prior to 90 days before the baseline HbA1c measurement. These calculations are conducted for the medication classes shown in [Table 1]. Finally, other relevant information including patients' demographics (age and gender), laboratory test results (e.g., sodium, triglycerides, estimated glomerular filtration rate), vital signs (body weight, body mass index, and blood pressure), and diagnoses are extracted as additional features. Additional features such as the patient's insurance status were evaluated but were not included in the final model due to their limited contribution to the explanatory power of the predictive models.
The latest laboratory test results and the latest vital signs before the baseline HbA1c measurement are extracted and converted to clinically meaningful categorical values (e.g., low, normal, and high). When the applicable value is missing, it is expressed as a single categorical value (i.e., “missing”). ICD9/ICD10 codes associated with the visits within the past year are extracted as diagnosis features. The diagnosis codes are categorized into 135 categories using the second-level categories of the Clinical Classification Software[36] (CCS) and then converted to binary vectors where each element represents the presence or absence of a corresponding CCS in the past year. [Table 2] shows an example of analytics-ready vector data. The relevant predictive features consist of two demographics, eight laboratory test results, four vital signs, and 135 CCS codes.
Abbreviations: BMI, body mass index; eGFR, estimated glomerular filtration rate; HbA1c, hemoglobin A1c; MET, metformin; NPDs, newly prescribed drugs; OPDs, originally prescribed drugs; PDC, proportion of days covered; SUL, sulfonylureas.
Graph Construction
TPG consists of nodes and directed edges. Each node describes one treatment strategy (i.e., a combination of drugs), and each directed edge describes a treatment transition from one to another. [Fig. 1] shows an example TPG. In this example, the “no medication” node has two directed edges, the one returning to itself and the other progressing to the “metformin” node. The graph describes a situation where a patient without any diabetes medications is likely to either: (1) stay in the same state or (2) progress to the next stage, taking metformin as the first prescription. TPG construction is performed by stratifying the analytics-ready vector data by their treatment transitions consisting of OPDs and NPDs. The OPDs and NPDs with the PDC equal to or greater than 80% are extracted and used for the stratification.

For each transition, the frequency of transition and the valid range of HbA1c levels are calculated and registered based on the data distribution. This information is used to help identify whether a transition is a feasible option for a patient based on his/her OPDs and baseline HbA1c level when generating personalized treatment outcome predictions for a patient. [Fig. 2] shows how the valid HbA1c range is calculated for a treatment option. The HbA1c distribution belonging to the transition is smoothed by applying an average filter that sums the number of records. After smoothing, the bins where sample sizes are larger than 10 are merged into the valid range. The averaging kernel size is set to 10 where the HbA1c level is less than 10% and 20 where the HbA1c level is greater than or equal to 10%. Only bins with a size of at least 10 are considered valid.

Model Construction
Treatment outcome prediction models are constructed for every treatment transition in the graph ([Fig. 3]). Each model is constructed from vector data belonging to the same transition. Models that are the same color can be regarded as comparable since these models share common OPDs. The target variable of each model is the probability of achieving treatment targets such as controlling HbA1c to less than 7.0% within 3 or 6 months. We selected the probability as the prediction target rather than a continuous HbA1c level because the variance of the point-estimations of HbA1c levels is very large. Also, we felt that the probability of reaching the treatment goal would be easier for patients to understand than an estimated mean value with a confidence interval, especially when comparing multiple alternate treatment options side-by-side.

To enable robust predictions even when the sample size is not large, models are constructed as stacked ML models that consist of support vector regression[37] (SVR) and logistic regression[38] (LR) ([Fig. 4]). The SVR models the nonlinear relationship between the baseline HbA1c and the posterior HbA1c since the baseline HbA1c is a dominant predictor of treatment outcome. The LR considers the effect of other auxiliary predictors of treatment outcome. The LR also converts outputs to probabilities.

To predict the impact of weight loss as well as pharmacotherapy, the likely impact of 5% weight loss is embedded into each model between the two models. The effect is calculated by the following equation, which was introduced based on a systematic review of prospective weight loss trials in patients with T2DM[39]:
ΔHbA1c = á + â · ΔWeight + ã · (BaselineHbA1c − 7.7) · ΔWeight
where á = −0.084, â = 0.101, ã = 0.025, and ΔWeight represents a percent change.
Personalized Prediction
When TPGE performs predictions, the OPDs of the target patient are used to identify the patient's position in the TPG. Based on the set of edges connected to the patient's node, the valid treatment options are extracted. The prediction algorithm then performs outcome prediction for every treatment option indicated by prediction parameters. If a specified option is not included in the valid transitions or the patient's HbA1c level is out of the valid range corresponding to the option, an exception is returned to signify that there are not enough past records to perform a valid prediction for the option. This approach is designed to prevent excessive extrapolations that may lead to speculative and inaccurate predictions.
While the general T-learner approach focuses on the difference of the expected outcomes between treatment units and control units, TPGE mainly focuses on the expected outcome of each treatment option and uses it as an output value. The reason is that the comparable treatment transitions on TPG share the same control group and retain the magnitude relation between their expected outcomes with or without comparison to the outcome of the control condition.
Model Evaluation
We applied TPGE to actual patient care data from University of Utah Health and compared its performance with other baseline ML methods. The dataset contained information on 27,904 patients with T2DM who were cared for in the primary care clinics of University of Utah Health. The inclusion criteria of the data and the evaluation processes are shown in [Fig. 5]. The dataset encompassed January 2012 through June 2017.

A total of 30,364 and 30,109 records belonging to 10,921 patients meeting the criteria were extracted for 3-month and 6-month predictions, respectively. They were randomly divided into a training set and a testing set in a ratio of 7:3, with records from the same patient being distributed to only one of the datasets. [Table 3] shows the data characteristics for the 14 analyzed features besides diagnoses and medications. These features were selected based on (1) correlation analysis between the features and the posterior HbA1c levels, (2) review and discussion of sample patient cases by the project team, which includes two practicing primary care physicians (M.F. and F.H.S.) and a practicing clinical pharmacist (K.M.T.), and (3) availability of support for the data in standard EHR–FHIR interfaces.
|
Category |
Item |
Value[a] |
|---|---|---|
|
Demographic data |
Age |
60.7 y old |
|
Gender |
Male 46.6%, Female 53.4% |
|
|
Vital signs |
Body weight |
95.5 kg |
|
Body mass index |
33.7 kg/m2 |
|
|
Systolic blood pressure |
127.9 mm Hg |
|
|
Diastolic blood pressure |
74.6 mm Hg |
|
|
Laboratory tests |
HbA1c |
7.4% |
|
Sodium |
138.6 mmol/L |
|
|
Aspartate transaminase (AST) |
27.7 U/L |
|
|
Low-density lipoprotein (LDL) |
90.8 mg/dL |
|
|
Total protein |
7.3 g/dL |
|
|
Fasting glucose |
143.5 mg/dL |
|
|
Triglycerides |
182.4 mg/dL |
|
|
Estimated glomerular filtration rate (eGFR) |
71.0 mL/min/1.73 m2 |
a Mean for numeric items, ratio for categorical items.
As a qualitative evaluation, we conducted a fivefold cross validation for hyperparameter tuning on the training dataset, then conducted the final evaluation using the testing dataset. The Brier Score[40] (BS) was used to evaluate the accuracy of predicted probabilities for both the validation and final evaluation. As baseline ML models, RF and GBT were evaluated using the same evaluation process. Both algorithms were applied to the analytics-ready vector directly. Hyperparameters of all the models are available in the [Supplementary Table S1] (available in the online version only). To transform the outputs of RF and GBT into probability distributions, two types of models, one without any calibrations and the other one with Platt calibration,[41] were trained simultaneously in the validation process. Then, the better performing model was selected for each algorithm. For summarized performance evaluation, we evaluated the overall BSs for all supported transitions. In this evaluation process, when the number of records on each treatment transition was smaller than 10, we did not construct the corresponding model for that transition and dropped those records from the evaluation framework. As described below, this means that all possible transitions are not covered by this evaluation. The treatment transitions supported by TPGE are investigated in terms of potential transitions and associated number of records.
In addition to the qualitative evaluation, we conducted a simulation study to evaluate the potential advantage of TPGE with regard to robustness of prediction. We created simulated patient records for every treatment transition in the testing dataset by setting their values to the population median of each treatment transition, duplicating these records, and setting the baseline HbA1c level to values spanning 6.5 to 10.5% in increments of 0.1%. We applied all models to predict the probability of achieving HbA1c of less than 7.0% within 3 months. We then compared the prediction results to the actual rate of goal achievement for patients with similar characteristics in the testing dataset.
EHR Integration
Our vision was to integrate a CDS tool with the EHR to seamlessly support T2DM pharmacotherapy decisions that leverage the experience of past patients through predictive analytics. We developed an EHR-integrated, AI-driven CDSS encapsulating the prediction models. The CDSS was developed based on the Health Level Seven International (HL7) Substitutable Medical Applications and Reusable Technologies on Fast Healthcare Interoperability Resources[42] (SMART on FHIR) framework, which is a framework for integrating web-based applications into the native EHR user interface that is gaining significant adoption among EHR vendors.[43] [44]
[Fig. 6] provides an overview of the CDSS that consists of three primary components: a Python-based prediction module, an OpenCDS-based web service for encapsulating the prediction module and providing guidance, and a SMART on FHIR web-based dashboard built on Ratpack.[45] The prediction module was built on Flask,[46] a Python-based web application framework.
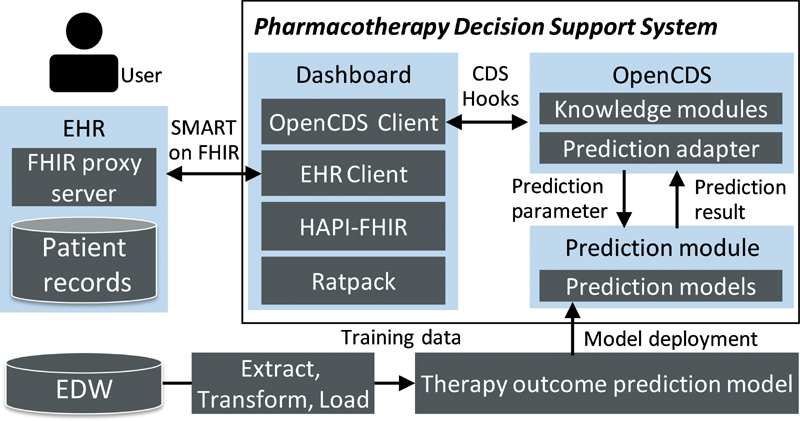
OpenCDS is a standard-based web service framework for CDS that includes a CDS Hooks[47] interface for receiving patient data as FHIR resources, processing the data using discrete knowledge modules, and providing CDS guidance back to the EHR.[48] In this study, we encapsulated the prediction module as an OpenCDS knowledge module. The CDSS uses this CDS web service to process FHIR patient resources that serve as prediction parameters through the CDS Hooks interface.
The dashboard uses the HAPI-FHIR[49] application programming interface (API) to obtain and manipulate FHIR Draft Standard For Trial Use Release 2 (DSTU2) data from the EHR, and SMART is used to integrate the CDSS with the EHR user interface. The dashboard can provide the relevant important information ([Table 4]) as well as prediction results to help clinicians and patients select the personalized treatment strategy by mutual agreement. The patient's insurance information is pulled from EHR as an FHIR coverage resource. The covered drug list was compiled by a clinical pharmacist. Information on the benefits and risks was compiled from the ADA Standards of Diabetes Care.[25] The medication cost provided is the National Average Drug Acquisition Cost (NADAC) provided by the Center for Medicare and Medicaid Services.[50]
|
Category |
Information provided |
|---|---|
|
Current state |
Relevant laboratory results (e.g., HbA1c) and vital signs (e.g., weight)[a] Medication treatment history[a] Allergies to diabetes medications[a] |
|
Treatment goal |
HbA1c goal in 3 or 6 mo[b] |
|
Treatment options |
Success rate of medication options[c] Benefits and side effects of medication options[d] Rule-based guidance for medication options[d] Medication cost information, including coverage by the patient's insurance provider[d] |
|
Review |
Previous treatment goal[a] Summary of treatment plan |
Abbreviations: CDS, clinical decision support; EHR, electronic health record; HbA1c, hemoglobin A1c.
a Extracted from EHR.
b Input on dashboard.
c Prediction result.
d Computed using EHR data and CDS knowledge base.
The EHR used was Epic. The native EHR infrastructure for SMART on FHIR was generally used, with the exception of additional FHIR interfaces that were implemented by the project team to support the Goal and insurance Coverage FHIR resources on a proxy server that augmented the FHIR interfaces provided natively by the EHR. The standard EHR-supported FHIR resources used included resources for patient, medication, medication order, observation, and allergy intolerance.
User Centered Design Process
The methods used to design the dashboard were iterative and conducted over many months. The team consisted of two physicians, two pharmacists, two cognitive psychologists, as well as the technical team. Methods began with team review of prototypes, followed by a formal heuristic review of the display, and, finally, a formal user-based vignette-based study involving six users. The simulation study focused on three levels: (1) basic usability, including visibility, clarity, navigation, and understandability; (2) assessment of usefulness and adequate functionality for making clinical decisions, including information needs, task sequencing, error recovery, and query tools; and (3) perceived satisfaction, learnability, and effort. At each stage, the dashboard was modified based on results. A fuller review of the user experience, design, and formative evaluation is currently in progress.
Results
Model Evaluation
Through the TPG construction, 67 treatment transitions were extracted for 3-month predictions. Thirty-two transitions were for adding or changing drugs and 35 transitions were for keeping the OPDs. Sixty-one treatment transitions were extracted for 6-month predictions. Twenty-eight transitions were for adding or changing drugs and 33 transitions were for keeping the OPDs. The coverages of treatment paths for 3-month and 6-month predictions were 93.7 and 95.1% with regard to the number of records, respectively. All the transitions, their valid HbA1c range, and the number of records are available in [Supplementary Tables S2] and [S3] (available in the online version only).
[Tables 5] and [6] show the performance of all methods for 3- and 6-month predictions, respectively. With the validation dataset, TPGE resulted in the best performance for all treatment targets and prediction durations. With the testing dataset, TPG resulted in the best performance for all five treatment targets for 3-month predictions and for three of five targets for 6-month predictions. TPGE resulted in the best performance for the average of all treatment targets for both prediction durations.
Abbreviations: BS, Brier Score; GBT, Gradient Boosting Tree; RF, Random Forest; TPGE, Treatment Pathway Graph-based Estimation.
Abbreviations: BS, Brier Score; GBT, Gradient Boosting Tree; RF, Random Forest; TPGE, Treatment Pathway Graph-based Estimation.
Note: Parentheses denote standard deviations in cross validation.
[Figure 7] shows the simulation results for one treatment transition from MET to MET + SUL. The prediction curves of all models exist within the confidence interval of the actual target-achievement ratio. TPGE shows the smoothest response along changes in patients' baseline HbA1c level. RF and GBT have regions in which the probability does not respond to changes in HbA1c levels, especially those over 8.5%. These regions in the RF and GBT models may deliver information that do not make sense to clinicians and patients, as increases in baseline HbA1c levels should—but do not—decrease the probability of reaching the treatment goal under these models.

Integration with EHR
The CDSS utilizing the prediction models was successfully integrated with the Epic EHR of University of Utah using SMART on FHIR, and iterative enhancements have been made based on clinician feedback. [Figure 8] shows the Options Comparison tab of the dashboard. This tab enables clinicians and patients to compare up to three potential treatment options as well as weight loss with regard to: (1) the predicted success rate of achieving treatment goals, (2) risks, benefits, and medication costs, and (3) relevant medications from the drug class included in formulary of the patient's insurance plan. The treatment goal can be set at 3 or 6 months for a target HbA1c value of 6.5, 7.0, 7.5, 8.0 or 8.5%. The relevant data are pulled from the EHR as FHIR patient, observation, medication order and goal resources.

The CDSS is available in the production EHR system at University of Utah Health. The application has been accessed by 70 users for 554 patients between October 1st, 2018 and December 31st, 2020.
Discussion
Summary of findings: To help address the significant burdens associated with the management of T2DM, this project sought to develop AI-driven CDS methods. A novel analytical method that we refer to as TPGE was developed for treatment outcome predictions. Using a dataset of 27,904 patients with diabetes, models for predicting the outcome of T2DM pharmacotherapy were developed, and these models were found to outperform baseline ML models using GBT and RF methods. We also successfully integrated the predictive models into the EHR through a SMART on FHIR dashboard that complements the predictive models with rule-based knowledge and leverages the open-source and standards-based OpenCDS platform.
Strengths: A key strength of this study is that we have described a novel approach to developing predictive models for treatment outcome predictions that has several benefits over traditional ML approaches such as GBT and RF. These advantages include enhanced predictive performance; predictions that are more aligned with clinical intuition on how treatment success should change with patients' baseline values; high coverage for treatment patterns encountered in actual clinical practice; and a systematic approach to identifying when there is insufficient data to provide an accurate prediction. Second, to our knowledge, this manuscript represents the first description of an application integrated with a major commercial EHR system that directly supports treatment selection in chronic disease management by using predictive modeling. In particular, the use of SMART on FHIR increases the dissemination potential of the application given the significant degree to which major commercial EHR vendors including Epic and Cerner are supporting this approach to enable an app-based ecosystem for innovation and care improvement. Third, while there are undoubtedly significant potential benefits for employing ML in the management of common chronic conditions, it is not always clear how best to integrate the insights generated from these computational techniques into busy primary care practices. Thus, this study provides useful information on how such ML-based insights can be interwoven with other information that primary care clinicians find valuable.
Limitations: One limitation of this study is that confounders may exist outside of the explanatory variables included in the models. However, we did include many variables, the models have strong predictive power, and additional variables were initially explored, even if not ultimately included in the final models. We are also considering, but have not yet, used methods such as propensity scoring[51] to adjust for this confounding. A second limitation of this study is that our CDSS is currently unable to predict the impact of dosage changes, changes in therapeutic agents within a drug class, or rare pharmacotherapy regimens with a small sample size. The solution to these limitations will be to increase the scope of the dataset used for model development, and active efforts are underway to do so. As a third limitation, not all information that is desired by clinicians and patients to decide on T2DM management is available in the CDSS. For example, users have asked for additional information, in particular the actual patient co-pay costs for different medications rather than estimates of costs. We anticipate including this type of information as APIs mature for obtaining such financial information at the point of care. As a fourth limitation, the full implication of providing ML results to clinicians and patients has not been fully explored. There may be bias in how the information is interpreted, clinicians may be uncertain about how to apply the information, and there may be issues of matching the data to the clinical question that have not been fully clarified. To evaluate the actual effectiveness of our methods, a formative evaluation of our CDSS has been conducted through prospective evaluation at the University of Utah. Fifth, external validation is needed for the model training approach as well as resulting predictive models, and evaluation is needed on the extent to which models trained in this manner require local adaptation prior to use. Active work is currently underway in this area. Sixth, the models, model training tools, and SMART on FHIR app are not currently publically available. We are exploring potential options for disseminating these artifacts. Finally, we have not yet deployed the SMART on FHIR app across health systems and EHR platforms. While many of the requirements of the app are widely supported across health systems and EHR platforms (e.g., SMART on FHIR approach to app integration, FHIR resources included in the U.S. Core Data for Interoperability), and some core FHIR data such as medications and conditions are already mapped to standard codes in EHR systems, there are several areas where additional local adaptations may be required. For example, the FHIR Coverage resource is not a part of the U.S. Core Data for interoperability, as such, providing insurance-based financial guidance will require broad adoption of the FHIR resource across EHR platforms or the augmentation of the EHR platform to support this information, as was done in our implementation. Such augmentation may not be technically possible in all EHR platforms. Furthermore, local data (e.g., laboratory data) may need to be mapped to standard terminologies such as Logical Observation Identifiers Names and Codes (LOINC) where not already done. However, the data points requiring mapping are finite, and with appropriate tools and processes, such mappings can be completed efficiently and accurately. Thus, while challenges certainly exist, we remain optimistic that the core functionality of the SMART on FHIR CDSS app described in this manuscript can be widely deployed.
Implications: This study shows that machine learning insights can be introduced to the point of care using approaches including treatment outcome modeling, SMART on FHIR for EHR integration, a patient-friendly user interface, and the incorporation of supplemental information important to the decision-making processing. If individualized predictions are misaligned with population-based recommendations from standard clinical practice guidelines, it is essential that clinicians and patients are provided with all the information needed to make an informed decision together.
Future directions: Moving forward, we are in the process of conducting a prospective evaluation of our methods. Moreover, we are seeking to use larger datasets to enable predictions based on individual medications (rather than medication classes), dosage history, and less frequently prescribed medication regimens.
Conclusion
A novel approach to developing predictive models for treatment outcomes of chronic diseases was proposed and found to outperform traditional ML approaches. These predictive models were then successfully integrated with the EHR through a SMART on FHIR CDSS for T2DM. The approach used could potentially be applied to many other chronic conditions to bring AI-driven CDSS to the point of care. A formal prospective evaluation is underway for evaluating the impact of the developed system on patient outcomes.
Conflict of Interest
S.T., W.T., G.C., J.K., and H.B. are employees of Hitachi, Ltd. University of Utah researchers conducted the research under sponsored research funding from Hitachi, Ltd. Hitachi may use the results of the research to provide a commercial CDS solution and has applied for a patent related to TPGE methodology. K.K. reports honoraria, consulting, sponsored research, licensing, or co-development outside the submitted work in the past 3 years with McKesson InterQual, Hitachi, Pfizer, Premier, Klesis Healthcare, RTI International, Mayo Clinic, Vanderbilt University, University of Washington, University of California at San Francisco, MD Aware, and the U.S. Office of National Coordinator for Health IT (via ESAC and Security Risk Solutions) in the area of health information technology. K.K. was also an unpaid board member of the nonprofit Health Level Seven International health IT standard development organization, he is an unpaid member of the U.S. Health Information Technology Advisory Committee, and he has helped develop several health IT tools which may be commercialized to enable wider impact. The other authors have no potential competing interest to declare.
-
References
- 1 Contreras I, Vehi J. Artificial intelligence for diabetes management and decision support: literature review. J Med Internet Res 2018; 20 (05) e10775
- 2 Rigla M, García-Sáez G, Pons B, Hernando ME. artificial intelligence methodologies and their application to diabetes. J Diabetes Sci Technol 2018; 12 (02) 303-310
- 3 Battineni G, Sagaro GG, Chinatalapudi N, Amenta F. Applications of machine learning predictive models in the chronic disease diagnosis. J Pers Med 2020; 10 (02) E21
- 4 Polat H, Danaei Mehr H, Cetin A. Diagnosis of chronic kidney disease based on support vector machine by feature selection methods. J Med Syst 2017; 41 (04) 55
- 5 Mcheick H, Saleh L, Ajami H, Mili H. Context relevant prediction model for COPD domain using Bayesian belief network. Sensors (Basel) 2017; 17 (07) 1486
- 6 Jain D, Singh V. Feature selection and classification systems for chronic disease prediction: a review. Egypt Inform J 2018; 19 (03) 179-189
- 7 Huang GM, Huang KY, Lee TY, Weng J. An interpretable rule-based diagnostic classification of diabetic nephropathy among type 2 diabetes patients. BMC Bioinformatics 2015; 16 01, Suppl 1): S5
- 8 Contreras I, Quirós C, Giménez M, Conget I, Vehi J. Profiling intra-patient type I diabetes behaviors. Comput Methods Programs Biomed 2016; 136: 131-141
- 9 Dagliati A, Marini S, Sacchi L. et al. Machine learning methods to predict diabetes complications. J Diabetes Sci Technol 2018; 12 (02) 295-302
- 10 Debon R, Coleone JD, Bellei EA, De Marchi ACB. Mobile health applications for chronic diseases: a systematic review of features for lifestyle improvement. Diabetes Metab Syndr 2019; 13 (04) 2507-2512
- 11 Sanchez-Morillo D, Fernandez-Granero MA, Leon-Jimenez A. Use of predictive algorithms in-home monitoring of chronic obstructive pulmonary disease and asthma: a systematic review. Chron Respir Dis 2016; 13 (03) 264-283
- 12 Forlenza GP, Li Z, Buckingham BA. et al. Predictive low-glucose suspend reduces hypoglycemia in adults, adolescents, and children with type 1 diabetes in an at-home randomized crossover study: results of the PROLOG trial. Diabetes Care 2018; 41 (10) 2155-2161
- 13 Miller DD, Brown EW. Artificial intelligence in medical practice: the question to the answer?. Am J Med 2018; 131 (02) 129-133
- 14 Montani S, Striani M. Artificial intelligence in clinical decision support: a focused literature survey. Yearb Med Inform 2019; 28 (01) 120-127
- 15 Lourdusamy R, Mattam XJ. Clinical decision support systems and predictive analytics. In: Jain V, Chatterjee JM. eds. Machine Learning with Health Care Perspective. Cham: Springer; 2020: 317-355
- 16 O'Connor PJ, Sperl-Hillen JM, Fazio CJ, Averbeck BM, Rank BH, Margolis KL. Outpatient diabetes clinical decision support: current status and future directions. Diabet Med 2016; 33 (06) 734-741
- 17 Bertsimas D, Kallus N, Weinstein AM, Zhuo YD. Personalized diabetes management using electronic medical records. Diabetes Care 2017; 40 (02) 210-217
- 18 Wang Y, Li PF, Tian Y, Ren JJ, Li JS. A shared decision-making system for diabetes medication choice utilizing electronic health record data. IEEE J Biomed Health Inform 2017; 21 (05) 1280-1287
- 19 Segagni D, Sacchi L, Dagliati A. et al. Improving clinical decisions on T2DM patients integrating clinical, administrative and environmental data. Stud Health Technol Inform 2015; 216: 682-686
- 20 Dagliati A, Sacchi L, Tibollo V. et al. A dashboard-based system for supporting diabetes care. J Am Med Inform Assoc 2018; 25 (05) 538-547
- 21 Curran RL, Kukhareva PV, Taft T. et al. Integrated displays to improve chronic disease management in ambulatory care: a SMART on FHIR application informed by mixed-methods user testing. J Am Med Inform Assoc 2020; 27 (08) 1225-1234
- 22 Breiman L. Random forests. Mach Learn 2001; 45 (01) 5-32
- 23 Friedman J. Greedy function approximation: a gradient boosting machine. Ann Stat 2000; 29: 1189-1232
- 24 Fang G, Annis IE, Elston-Lafata J, Cykert S. Applying machine learning to predict real-world individual treatment effects: insights from a virtual patient cohort. J Am Med Inform Assoc 2019; 26 (10) 977-988
- 25 American Diabetes Association. Standards of medical care in diabetes—2018. Diabetes Care 2018; 41 (Suppl. 01) S1-S2
- 26 Edelman SV, Polonsky WH. Type 2 diabetes in the real world: the elusive nature of glycemic control. Diabetes Care 2017; 40 (11) 1425-1432
- 27 Khunti K, Gomes MB, Pocock S. et al. Therapeutic inertia in the treatment of hyperglycaemia in patients with type 2 diabetes: a systematic review. Diabetes Obes Metab 2018; 20 (02) 427-437
- 28 Stark Casagrande S, Fradkin JE, Saydah SH, Rust KF, Cowie CC. The prevalence of meeting A1C, blood pressure, and LDL goals among people with diabetes, 1988-2010. Diabetes Care 2013; 36 (08) 2271-2279
- 29 Kirkman MS, Rowan-Martin MT, Levin R. et al. Determinants of adherence to diabetes medications: findings from a large pharmacy claims database. Diabetes Care 2015; 38 (04) 604-609
- 30 Okemah J, Peng J, Quiñones M. Addressing clinical inertia in type 2 diabetes mellitus: a review. Adv Ther 2018; 35 (11) 1735-1745
- 31 Reach G, Pechtner V, Gentilella R, Corcos A, Ceriello A. Clinical inertia and its impact on treatment intensification in people with type 2 diabetes mellitus. Diabetes Metab 2017; 43 (06) 501-511
- 32 Strain WD, Blüher M, Paldánius P. Clinical inertia in individualising care for diabetes: is there time to do more in type 2 diabetes?. Diabetes Ther 2014; 5 (02) 347-354
- 33 Khunti K, Millar-Jones D. Clinical inertia to insulin initiation and intensification in the UK: a focused literature review. Prim Care Diabetes 2017; 11 (01) 3-12
- 34 Künzel SR, Sekhon JS, Bickel PJ, Yu B. Metalearners for estimating heterogeneous treatment effects using machine learning. Proc Natl Acad Sci U S A 2019; 116 (10) 4156-4165
- 35 Athey S, Imbens G. Recursive partitioning for heterogeneous causal effects. Proc Natl Acad Sci U S A 2016; 113 (27) 7353-7360
- 36 HCUP. HCUP User Support. Accessed October 2020 at: https://www.hcup-us.ahrq.gov/
- 37 Drucker H, Burges CJC, Kaufman L, Smola A, Vapnik V. Support vector regression machines. Adv Neural Inf Process Syst 1997; 9: 155-161
- 38 Cox DR. The regression analysis of binary sequences (with discussion). J R Stat Soc B 1958; 20: 215-242
- 39 Gummesson A, Nyman E, Knutsson M, Karpefors M. Effect of weight reduction on glycated haemoglobin in weight loss trials in patients with type 2 diabetes. Diabetes Obes Metab 2017; 19 (09) 1295-1305
- 40 Brier GW. Verification of forecasts expressed in terms of probability. Mon Weather Rev 1950; 78: 1-3
- 41 Platt J. Probabilistic outputs for support vector machines and comparisons to regularized likelihood methods. Adv Large Margin Classifiers 1999; 10 (03) 61-74
- 42 HL7 FHIR. Welcome to FHIR®. Accessed December 2020 at: https://www.hl7.org/fhir/
- 43 Mandel JC, Kreda DA, Mandl KD, Kohane IS, Ramoni RB. SMART on FHIR: a standards-based, interoperable apps platform for electronic health records. J Am Med Inform Assoc 2016; 23 (05) 899-908
- 44 Mandl KD, Mandel JC, Murphy SN. et al. The SMART platform: early experience enabling substitutable applications for electronic health records. J Am Med Inform Assoc 2012; 19 (04) 597-603
- 45 Ratpack. Accessed December 2020 at: https://ratpack.io/
- 46 Flask. Users Guide. Accessed December 2020 at: http://flask.pocoo.org/
- 47 Hooks CDS. . Accessed December 2020 at: https://cds-hooks.hl7.org/
- 48 OpenCDS. . Accessed December 2020 at: http://www.opencds.org/
- 49 HAPI-FHIR. Global Good: Powering Interoperability Around the World for 18 Years. Accessed December 2020 at: http://hapifhir.io/
- 50 The Centers for Medicare & Medicaid Services. Data.CMS.GOV. Accessed December 2020 at: https://data.cms.gov/
- 51 Rosenbaum PR, Rubin DB. The central role of the propensity score in observational studies for causal effects. Biometrika 1983; 70: 41-55
Address for correspondence
Publication History
Received: 10 December 2020
Accepted: 21 February 2021
Article published online:
11 May 2021
© 2021. The Author(s). This is an open access article published by Thieme under the terms of the Creative Commons Attribution-NonDerivative-NonCommercial License, permitting copying and reproduction so long as the original work is given appropriate credit. Contents may not be used for commercial purposes, or adapted, remixed, transformed or built upon. (https://creativecommons.org/licenses/by-nc-nd/4.0/)
Georg Thieme Verlag KG
Rüdigerstraße 14, 70469 Stuttgart, Germany
-
References
- 1 Contreras I, Vehi J. Artificial intelligence for diabetes management and decision support: literature review. J Med Internet Res 2018; 20 (05) e10775
- 2 Rigla M, García-Sáez G, Pons B, Hernando ME. artificial intelligence methodologies and their application to diabetes. J Diabetes Sci Technol 2018; 12 (02) 303-310
- 3 Battineni G, Sagaro GG, Chinatalapudi N, Amenta F. Applications of machine learning predictive models in the chronic disease diagnosis. J Pers Med 2020; 10 (02) E21
- 4 Polat H, Danaei Mehr H, Cetin A. Diagnosis of chronic kidney disease based on support vector machine by feature selection methods. J Med Syst 2017; 41 (04) 55
- 5 Mcheick H, Saleh L, Ajami H, Mili H. Context relevant prediction model for COPD domain using Bayesian belief network. Sensors (Basel) 2017; 17 (07) 1486
- 6 Jain D, Singh V. Feature selection and classification systems for chronic disease prediction: a review. Egypt Inform J 2018; 19 (03) 179-189
- 7 Huang GM, Huang KY, Lee TY, Weng J. An interpretable rule-based diagnostic classification of diabetic nephropathy among type 2 diabetes patients. BMC Bioinformatics 2015; 16 01, Suppl 1): S5
- 8 Contreras I, Quirós C, Giménez M, Conget I, Vehi J. Profiling intra-patient type I diabetes behaviors. Comput Methods Programs Biomed 2016; 136: 131-141
- 9 Dagliati A, Marini S, Sacchi L. et al. Machine learning methods to predict diabetes complications. J Diabetes Sci Technol 2018; 12 (02) 295-302
- 10 Debon R, Coleone JD, Bellei EA, De Marchi ACB. Mobile health applications for chronic diseases: a systematic review of features for lifestyle improvement. Diabetes Metab Syndr 2019; 13 (04) 2507-2512
- 11 Sanchez-Morillo D, Fernandez-Granero MA, Leon-Jimenez A. Use of predictive algorithms in-home monitoring of chronic obstructive pulmonary disease and asthma: a systematic review. Chron Respir Dis 2016; 13 (03) 264-283
- 12 Forlenza GP, Li Z, Buckingham BA. et al. Predictive low-glucose suspend reduces hypoglycemia in adults, adolescents, and children with type 1 diabetes in an at-home randomized crossover study: results of the PROLOG trial. Diabetes Care 2018; 41 (10) 2155-2161
- 13 Miller DD, Brown EW. Artificial intelligence in medical practice: the question to the answer?. Am J Med 2018; 131 (02) 129-133
- 14 Montani S, Striani M. Artificial intelligence in clinical decision support: a focused literature survey. Yearb Med Inform 2019; 28 (01) 120-127
- 15 Lourdusamy R, Mattam XJ. Clinical decision support systems and predictive analytics. In: Jain V, Chatterjee JM. eds. Machine Learning with Health Care Perspective. Cham: Springer; 2020: 317-355
- 16 O'Connor PJ, Sperl-Hillen JM, Fazio CJ, Averbeck BM, Rank BH, Margolis KL. Outpatient diabetes clinical decision support: current status and future directions. Diabet Med 2016; 33 (06) 734-741
- 17 Bertsimas D, Kallus N, Weinstein AM, Zhuo YD. Personalized diabetes management using electronic medical records. Diabetes Care 2017; 40 (02) 210-217
- 18 Wang Y, Li PF, Tian Y, Ren JJ, Li JS. A shared decision-making system for diabetes medication choice utilizing electronic health record data. IEEE J Biomed Health Inform 2017; 21 (05) 1280-1287
- 19 Segagni D, Sacchi L, Dagliati A. et al. Improving clinical decisions on T2DM patients integrating clinical, administrative and environmental data. Stud Health Technol Inform 2015; 216: 682-686
- 20 Dagliati A, Sacchi L, Tibollo V. et al. A dashboard-based system for supporting diabetes care. J Am Med Inform Assoc 2018; 25 (05) 538-547
- 21 Curran RL, Kukhareva PV, Taft T. et al. Integrated displays to improve chronic disease management in ambulatory care: a SMART on FHIR application informed by mixed-methods user testing. J Am Med Inform Assoc 2020; 27 (08) 1225-1234
- 22 Breiman L. Random forests. Mach Learn 2001; 45 (01) 5-32
- 23 Friedman J. Greedy function approximation: a gradient boosting machine. Ann Stat 2000; 29: 1189-1232
- 24 Fang G, Annis IE, Elston-Lafata J, Cykert S. Applying machine learning to predict real-world individual treatment effects: insights from a virtual patient cohort. J Am Med Inform Assoc 2019; 26 (10) 977-988
- 25 American Diabetes Association. Standards of medical care in diabetes—2018. Diabetes Care 2018; 41 (Suppl. 01) S1-S2
- 26 Edelman SV, Polonsky WH. Type 2 diabetes in the real world: the elusive nature of glycemic control. Diabetes Care 2017; 40 (11) 1425-1432
- 27 Khunti K, Gomes MB, Pocock S. et al. Therapeutic inertia in the treatment of hyperglycaemia in patients with type 2 diabetes: a systematic review. Diabetes Obes Metab 2018; 20 (02) 427-437
- 28 Stark Casagrande S, Fradkin JE, Saydah SH, Rust KF, Cowie CC. The prevalence of meeting A1C, blood pressure, and LDL goals among people with diabetes, 1988-2010. Diabetes Care 2013; 36 (08) 2271-2279
- 29 Kirkman MS, Rowan-Martin MT, Levin R. et al. Determinants of adherence to diabetes medications: findings from a large pharmacy claims database. Diabetes Care 2015; 38 (04) 604-609
- 30 Okemah J, Peng J, Quiñones M. Addressing clinical inertia in type 2 diabetes mellitus: a review. Adv Ther 2018; 35 (11) 1735-1745
- 31 Reach G, Pechtner V, Gentilella R, Corcos A, Ceriello A. Clinical inertia and its impact on treatment intensification in people with type 2 diabetes mellitus. Diabetes Metab 2017; 43 (06) 501-511
- 32 Strain WD, Blüher M, Paldánius P. Clinical inertia in individualising care for diabetes: is there time to do more in type 2 diabetes?. Diabetes Ther 2014; 5 (02) 347-354
- 33 Khunti K, Millar-Jones D. Clinical inertia to insulin initiation and intensification in the UK: a focused literature review. Prim Care Diabetes 2017; 11 (01) 3-12
- 34 Künzel SR, Sekhon JS, Bickel PJ, Yu B. Metalearners for estimating heterogeneous treatment effects using machine learning. Proc Natl Acad Sci U S A 2019; 116 (10) 4156-4165
- 35 Athey S, Imbens G. Recursive partitioning for heterogeneous causal effects. Proc Natl Acad Sci U S A 2016; 113 (27) 7353-7360
- 36 HCUP. HCUP User Support. Accessed October 2020 at: https://www.hcup-us.ahrq.gov/
- 37 Drucker H, Burges CJC, Kaufman L, Smola A, Vapnik V. Support vector regression machines. Adv Neural Inf Process Syst 1997; 9: 155-161
- 38 Cox DR. The regression analysis of binary sequences (with discussion). J R Stat Soc B 1958; 20: 215-242
- 39 Gummesson A, Nyman E, Knutsson M, Karpefors M. Effect of weight reduction on glycated haemoglobin in weight loss trials in patients with type 2 diabetes. Diabetes Obes Metab 2017; 19 (09) 1295-1305
- 40 Brier GW. Verification of forecasts expressed in terms of probability. Mon Weather Rev 1950; 78: 1-3
- 41 Platt J. Probabilistic outputs for support vector machines and comparisons to regularized likelihood methods. Adv Large Margin Classifiers 1999; 10 (03) 61-74
- 42 HL7 FHIR. Welcome to FHIR®. Accessed December 2020 at: https://www.hl7.org/fhir/
- 43 Mandel JC, Kreda DA, Mandl KD, Kohane IS, Ramoni RB. SMART on FHIR: a standards-based, interoperable apps platform for electronic health records. J Am Med Inform Assoc 2016; 23 (05) 899-908
- 44 Mandl KD, Mandel JC, Murphy SN. et al. The SMART platform: early experience enabling substitutable applications for electronic health records. J Am Med Inform Assoc 2012; 19 (04) 597-603
- 45 Ratpack. Accessed December 2020 at: https://ratpack.io/
- 46 Flask. Users Guide. Accessed December 2020 at: http://flask.pocoo.org/
- 47 Hooks CDS. . Accessed December 2020 at: https://cds-hooks.hl7.org/
- 48 OpenCDS. . Accessed December 2020 at: http://www.opencds.org/
- 49 HAPI-FHIR. Global Good: Powering Interoperability Around the World for 18 Years. Accessed December 2020 at: http://hapifhir.io/
- 50 The Centers for Medicare & Medicaid Services. Data.CMS.GOV. Accessed December 2020 at: https://data.cms.gov/
- 51 Rosenbaum PR, Rubin DB. The central role of the propensity score in observational studies for causal effects. Biometrika 1983; 70: 41-55