

Subscribe to RSS
DOI: 10.5999/aps.2015.42.5.567
Effects of Bariatric Surgery on Facial Features
Authors
Background Bariatric surgeries performed in the USA has increased twelve-fold in the past two decades. The effects of rapid weight loss on facial features has not been previously studied. We hypothesized that bariatric surgery will mimic the effects of aging thus giving the patient an older and less attractive appearance.
Methods Consecutive patients were enrolled from the bariatric surgical clinic at our institution. Pre and post weight loss photographs were taken and used to generate two surveys. The surveys were distributed through social media to assess the difference between the preoperative and postoperative facial photos, in terms of patients' perceived age and overall attractiveness. 102 respondents completed the first survey and 95 respondents completed the second survey.
Results Of the 14 patients, five showed statistically significant change in perceived age (three more likely to be perceived older and two less likely to be perceived older). The patients were assessed to be more attractive postoperatively, which showed statistical significance.
Conclusions Weight loss does affect facial aesthetics. Mild weight loss is perceived by survey respondents to give the appearance of a younger but less attractive patient, while substantial weight loss is perceived to give the appearance of an older but more attractive patient.
INTRODUCTION
Facial aging is a complex and multifactorial process which includes the synergistic interactions of facial fat volume and position, decreasing soft tissue elasticity and musculoskeletal changes [[1] [2]]. A number of studies have examined how these characteristics interact to give the appearance of natural aging. Factors which have been identified as core components within this model are loss of fatty tissue in specific regions of the face and unbalanced fat distribution in the morphologically distinct facial fat pads [[1] [3]].
Our study aim was to compare how facial fat loss effects the perception of an individual's age. We were able to assess the effects of facial fat loss by recruiting bariatric patients, who can lose up to 60% of their excess body weight within 6 months of the procedure [[4]]. In the past two decades, the number of bariatric surgeries has increased exponentially. It would be to the benefit of this expanding patient population to understand the full scope of the changes that will take place as a result of the procedure. To the best of our knowledge, there is no study which addresses the facial changes that take place after bariatric surgery. Based on extrapolations from existing literature, we hypothesized that massive weight loss in a short period of time will mimic aspects of facial aging, resulting in a perceived age older than the true chronological age of that patient. A secondary outcome that was addressed was the effect that bariatric surgery has on the overall facial attractiveness of the patient.
METHODS
Patient population
The study protocol was approved by the Institutional Review Board of Boston Medical Center. Between the months of October to December of 2012, patients were enrolled from the Bariatric Surgical Clinic at our hospital, a large urban tertiary medical center. Every patient between 18 and 65 years of age who was scheduled for a preoperative office visit was approached for participation in the study. Patients were excluded if they had undergone prior facial surgery, planned to undergo facial surgery in the study period, had a congenital head or neck malformation or deformity, or were unable to comprehend English. Photos were taken in the standard five view head series format: left profile, left oblique, frontal view, right oblique and right profile. During the follow up office visit, the preoperative photo was used to guide for establishing a comparable and all photographs were taken by the same research assistant to minimize variability that exists between multiple photographers. Follow up photography was obtained during a regularly scheduled visit to the bariatric clinic between 3 and 6 months after the operation. All patients used in the analysis underwent Roux-en-Y gastric bypass.
Outcome measure
Two online surveys were constructed on Qualtrics.com. Each survey included either the preoperative or postoperative photoset for each person, but not both ([Fig. 1]). Each survey included an equal number of preoperative and postoperative photosets. For each photoset, two questions were asked. The first question asked, "What is the age of this person?" Answer choices were collected by the selection of one of 13 ordinal variables with 5 years increments in age (i.e., <25 years of age, 25-30 years of age, 31-35 years of age, etc.). The second question asked, "How attractive is this person?" Answer choices were collected by means of a visual analogue scale labelled from 1 (not at all) to 10 (extremely attractive). Survey was distributed in the month of May through social media and social lists. One hundred two respondents completed the first survey and 95 respondents completed the second survey.

Statistical analysis
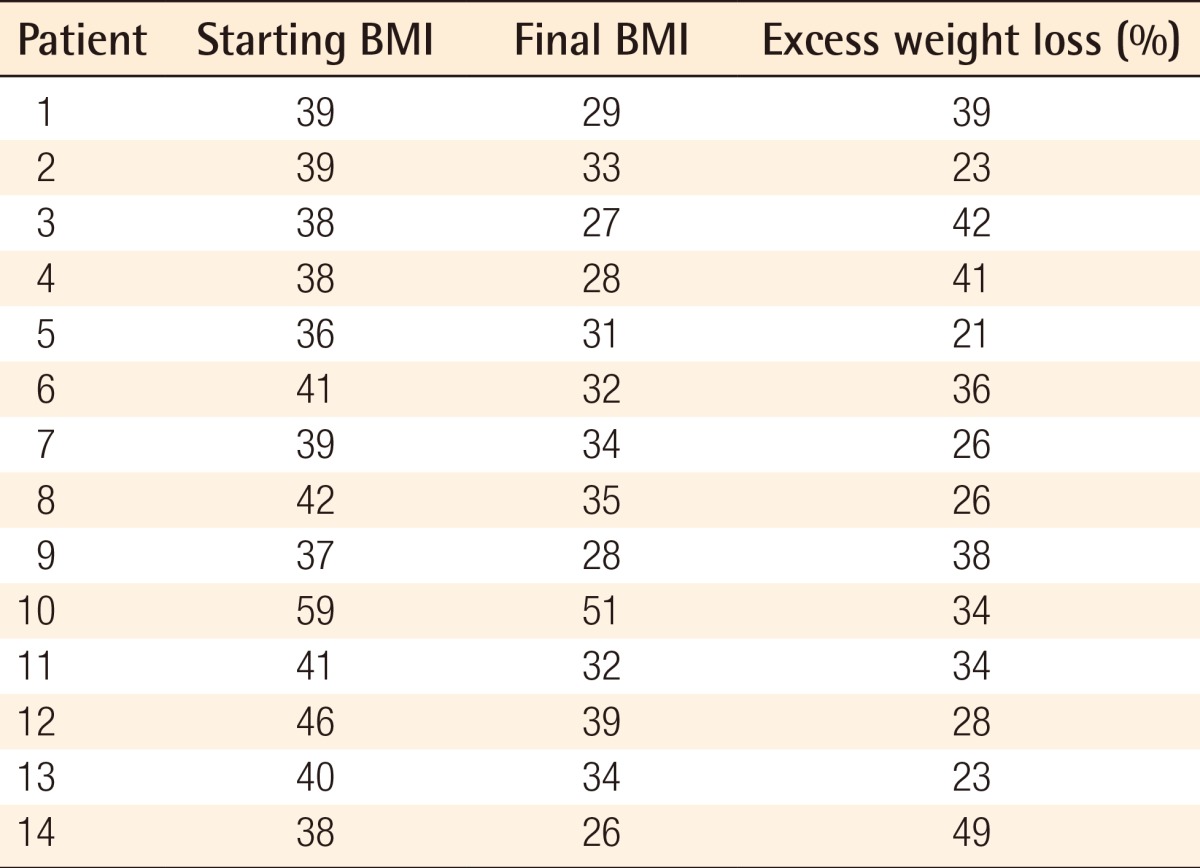
Summary statistics for the observed weight loss is summarized in [Table 1].
Perceived age of the participants were analysed by the creation of three categories: perceived to be younger than chronologic age, perceived to be accurate chronologic age and perceived to be older than chronologic age. The frequencies of these responses are summarized in [Table 2]. A Pearson's chi-square test was performed to analyse if the difference in responses between the preoperative and postoperative photosets was due to chance. Fisher's exact test was performed on samples with counts less than 5 in any cells. All tests were performed with a level of significance with an alpha of 0.05.

Analysis for the attractiveness of the participant was determined by calculating the mean score of the survey respondents for each photoset. The summary statistics for the preoperative photoset mean scores and postoperative photoset mean scores are shown in [Table 3]. A Student's t-test for a two sample matched dataset was performed using the mean preoperative score and the mean postoperative score as a matched dataset.

A Spearman's rho correlation coefficient was calculated between the body mass index (BMI) and the increase in the mean attractiveness score. A best fitting line was determined for the dataset for assessment of relationship.
Statistical computing was performed with the use of R (ver. 2.9.2, R Development Core Team, R Foundation for Statistical Computing, Vienna, Austria, 2009).
RESULTS
Twenty five patients gave informed consent and joined the study. The operation was cancelled for two patients due to intraoperative complications. Nine patients did not show up for their clinical visits within the follow up period and were considered lost-to-follow up. Fourteen patients, three males and eleven females, underwent the procedure and had follow-up photographs taken within the predefined follow-up period.
The mean total weight loss for our patient population was 20% of their initial body weight (range, 14%-32%).
Analysis of the perceived age of the patients shows that six of the patients were more likely to be perceived by the survey responders to be older after the weight loss, of which three have statistical significance. Five of the patients were more likely to be perceived by the respondents to be younger after the weight loss, of which two showed statistical significance. The remaining three patients showed no statistically significant association between weight loss and difference in their perceived age. The descriptive statistics are summarized in [Table 2].
Correlation analysis was performed to assess the relationship between the decrease in the patients' BMI and the change in the proportion of survey respondents who perceived the patient to be older on the postoperative photoset. A mild to moderate, positive correlation was noted, with a correlation coefficient of 0.352 (P=0.216). A best fit line was determined for the dataset ([Fig. 2]). It is notable that there is a shifting point, below which the patient is less likely to be perceived to be older and after which is increasingly more likely to be perceived to be older. This shifting point takes place with a decrease of 7.7 BMI points.

Analysis for the attractiveness of the patients shows that the survey respondents scored the postoperative photosets higher by an average of 0.256 points. The difference in the scores for the preoperative and postoperative photosets was statistically significant as the 95% confidence interval ranges from 0.004 to 0.507. Additionally, the calculated P-value is 0.047, which is less than the predefined significance level.
Correlation analysis was performed to assess the association between the decrease in the patients' BMI and the increase in the attractiveness score. A mild to moderate, positive association is noted with a correlation coefficient of 0.244 (P=0.401). A best fit line was determined for the dataset ([Fig. 3]). This analysis also is notable for the presence of a shifting point, below which the patient is likely to be perceived as less attractive and after which is increasingly more likely to be perceived as more attractive. This shifting point takes place with a decrease of 4.4 BMI points.

DISCUSSION
Bariatric procedures have been performed for over 60 years for multiple reasons, but the current guidelines for the surgical management of weight loss were established by the National Institutes of Health Consensus Conference in 1991. Shortly after, the "bariatric revolution" took place between 1998 and 2003, during which time the number of Roux-en-Y procedures performed in the United States grew from around 10,000 to 120,000 annually [[4] [5]].
With the increase in the incidence of this procedure, numerous studies were conducted to describe the effects of weight loss in relation to the trunk. To the best of our knowledge, there is no study that assesses the effects of weight loss on facial features. It is logical to assume that the weight loss following a bariatric procedure would affect the fat deposits in the head and neck, as it does anywhere else in the body.
The association between loss of fat deposits in the face and the sagging appearance of aging have been described in previous studies [[1]]. The results of our study support the notion that rapid loss of fat deposits in the face can change how a person is perceived, in regard to age and attractiveness. While the results for any given individual can vary, as was the case for our study population, the existent relationship is best observed by the scatter plots shown in [Figs. 2] and [3]. It needs to noted that the best fitting lines in these graphs have been extended beyond the margins of the data points thus the results near the vertical intercepts will likely not be as accurate. Patients who show mild weight loss are perceived to be younger postoperatively but less attractive. Patients who show substantial weight loss are perceived to look older postoperatively but more attractive. The transition point does not occur at the same level of weight loss for the perception of age and for the perception of attractiveness. Additionally, the loss of facial fat seems to be more accountable for the changes seen in the perceived age than to the changes seen in the attractiveness. It should be noted that the term 'attractive' was not specifically defined on the survey to allow the survey taker to rate the general attractiveness. It may be of benefit in future studies to frame questions aimed at assessing certain aspects of the face (e.g., proportions or presence of excess skin) to better understand which aspects most influence and/or contribute to attractiveness.
The conclusions are based on inspection of the scatter plots as the correlation analysis was not able to show statistical significance likely due to the high variability in the measured outcomes and the small number of patients in the study. In such a population, a large study population is needed to minimize the effects of chance or random error so that a true correlation can be detected.
It is a surprising finding that as the individual is more likely to be perceived to be older postoperatively, he or she is also more likely to be perceived to be more attractive. This is a substantial finding as it shows that the loss of facial fat is perceived in an overall positive manner. This is an important concept that needs to be addressed with patients prior to the procedure to assure full understanding of the effect of the procedure on the trunk and face. In our study, not all subjects showed a statistically significant change in their perceived age. Those with the most weight loss were not necessarily those with statistically significant change in their perceived age.
Our study was noted to have a number of limitation. The study design allowed for a maximum follow up period of 6 months, with the follow up photographs being taken between 3-6 months. Future studies should aim for a longer follow up periods with more participants to better assess this complex relationship and the association between weight loss and aesthetic changes. Due to our small study population size, our calculations were primarily based on nonparametric analysis, thus we were constrained in the conclusions that our dataset could support.
Conflict of Interest
No potential conflict of interest relevant to this article was reported.
-
References
- 1 Donofrio LM. Fat distribution: a morphologic study of the aging face. Dermatol Surg 2000; 26: 1107-1112
- 2 Coleman SR, Grover R. The anatomy of the aging face: volume loss and changes in 3-dimensional topography. Aesthet Surg J 2006; 26: S4-S9
- 3 Gierloff M, Stohring C, Buder T. et al. Aging changes of the midfacial fat compartments: a computed tomographic study. Plast Reconstr Surg 2012; 129: 263-273
- 4 Schirmer B, Hallowell P. Morbid obesity and its surgical treatment. In: Maingot R, Zinner MJ, Ashley SW. Maingot's abdominal operations. 12nd ed. New York: McGraw-Hill Medical; 2013: 545-578
- 5 Schirmer B, Schauer PR. The surgical management of obesity. In: Schwartz SI, Brunicardi FC. Schwartz's principles of surgery: ABSITE and board review. 9th ed. New York: McGraw-Hill Medical; 2011: 271-278
Correspondence
Publication History
Received: 02 December 2014
Accepted: 01 June 2015
Article published online:
05 May 2022
© 2015. The Korean Society of Plastic and Reconstructive Surgeons. This is an open access article published by Thieme under the terms of the Creative Commons Attribution-NonCommercial License, permitting unrestricted noncommercial use, distribution, and reproduction so long as the original work is given appropriate credit. Contents may not be used for commercial purposes. (https://creativecommons.org/licenses/by-nc/4.0/)
Thieme Medical Publishers, Inc.
333 Seventh Avenue, 18th Floor, New York, NY 10001, USA
-
References
- 1 Donofrio LM. Fat distribution: a morphologic study of the aging face. Dermatol Surg 2000; 26: 1107-1112
- 2 Coleman SR, Grover R. The anatomy of the aging face: volume loss and changes in 3-dimensional topography. Aesthet Surg J 2006; 26: S4-S9
- 3 Gierloff M, Stohring C, Buder T. et al. Aging changes of the midfacial fat compartments: a computed tomographic study. Plast Reconstr Surg 2012; 129: 263-273
- 4 Schirmer B, Hallowell P. Morbid obesity and its surgical treatment. In: Maingot R, Zinner MJ, Ashley SW. Maingot's abdominal operations. 12nd ed. New York: McGraw-Hill Medical; 2013: 545-578
- 5 Schirmer B, Schauer PR. The surgical management of obesity. In: Schwartz SI, Brunicardi FC. Schwartz's principles of surgery: ABSITE and board review. 9th ed. New York: McGraw-Hill Medical; 2011: 271-278