
Subscribe to RSS
DOI: 10.4103/ijri.IJRI_483_20
Retrospective analysis of chest HRCT findings in coronavirus disease pandemic (COVID-19)- An early experience
Financial support and sponsorship Nil.


Abstract
Context: Corona virus disease (COVID-19) has spread in a rampant manner all over the World causing severe acute respiratory illness. Prompt recognition of disease is invaluable to ensure timely treatment, and rapid patient isolation is crucial for containment of this communicable disease. Aims: To evaluate the performance of high resolution CT (HRCT) in the diagnosis of COVID-19. To establish the role of HRCT in prognosis of affected patients and to assess severity of disease based on HRCT findings. Settings and Design: This retrospective study included 216 patients admitted to our institute with a diagnosis of COVID-19 infection confirmed by nucleic acid RT-PCR testing. Subjects and Methods: Patients underwent non contrast HRCT chest examination and images were reconstructed in thin 1.25 mm lung window. Images were evaluated for presence of lung lesions & CT severity score was assigned to each patient based on number of lung lobes involved. Results: Ground-glass opacities (GGOs) with or without consolidation, interlobular septal thickening, the “reversed halo” sign (Atoll sign) and GGO’s with rounded nodular pattern are common CT features of COVID-19 Conclusions: Typical peripheral subpleural distributions of GGO’s with bilateral asymmetrical lung involvement are characteristic features of COVID19 pneumonia. Chest HRCT can be a very useful and standard imaging method to assess the severity and progression of the disease and thereby optimizing the management of patients. With increasing case load all over the world HRCT can be used as a one stop radiological investigation for the diagnosis and prognosis of corona virus disease.
Keywords
Atoll sign - coronavirus - COVID-19 - crazy –paving - ground glass opacities - PPE - RT-PCR - SARS-CoV-2Introduction
An outbreak of coronavirus disease 2019 (COVID-19) infection began in December 2019 in Wuhan, in China’s Hubei province.[[1], [2]] The novel coronavirus was named severe acute respiratory syndrome coronavirus 2 (SARS-CoV-2) by the International Committee on Taxonomy of Viruses.[[3]] Although the virus likely has a zoonotic origin related to the city’s Seafood Market, widespread human-to-human transmission has resulted in approximately 5 million cases and 5 lac deaths worldwide as of May 2020.[[3], [4], [5], [6], [7]] Disease was first reported in India on January 30, 2020, and the total number of cases in India has reached 1.9 lac with 5500 fatalities as of May 31, 2020.[[8]] The most common clinical symptoms at presentation are fever and cough in addition to other nonspecific symptoms including dyspnea, headache, muscle soreness, and fatigue.[[9]] About 20% of cases are severe, and mortality is approximately 3%.[[10]] The World Health Organization declared a global health emergency on January 30, 2020.[[11]] Prompt recognition of disease is invaluable to ensure timely treatment, and, from a public health perspective, rapid patient isolation is crucial for containment of this communicable disease.[[12]] In this study, we characterize chest HRCT findings in 216 patients infected with COVID-19 in the Kolhapur District of Maharashtra State of India till May 31, 2020 and admitted at our institute. The aim of our study is toevaluate the spectrum of HRCT findings in COVID-19 infected patients, to assess the severity of the disease based on HRCT findingsandto establish the role of HRCT chest as an investigative modality of choice for prognosis of COVID-19 infected patients.
Subjects and Methods
Study design: Retrospective Study.
Source of Data: Department of Medicine and Dept of Chest & TB of our Institute.
Duration of study: Mar 2020 to May 2020.
Sample size: 216.
Inclusion criteria
All patients diagnosed to be infected with COVID-19 virus by RT-PCR testing method tested at Govt approved laboratory at the Dept of Microbiology of our institute.
Exclusion criteria
Pregnant patients and debilitated patients requiring Ventilator Support not in a position to be shifted to CT Department.
Methodology
Our institute was designated as a dedicated COVID care Hospital by the district administration. To avert any potential breach of confidentiality, patient’s names were not revealed. Institutional Ethics committee approval was taken. From March 22, 2020, until May 31, 2020, 216 COVID-19 positive patients admitted to our hospital in Kolhapur district of Maharashtra State of India who underwent chest HRCT were enrolled in our study. Patient selection was consecutive. In addition to age and sex, clinical information collected included travel and exposure history (when known). The Government of India had divided all districts of the country into three zones namely Red, Orange and Green. Accordingly, all travellers who traveled from red zone who entered Kolhapur District were stopped at the district entry point and sent to our institute, wherein they underwent compulsory swab testing and thereafter Institutional Quarantine at Govt designated public and private places for asymptomatic individuals and hospitalization for symptomatic people. All patients were tested for COVID-19 infection at Govt approved laboratory testing at Dept of Microbiology of this institute as well as at the National Institute of Virology, Pune, with real-time reverse- transcriptase polymerase chain reaction (RT-PCR) of secretions obtained by nasopharyngeal swab. All CT scans were performed on Somatom Duo 128 slice CT scanner (Siemens Healthineers, Erlangen, Germany). Conventional non-contrast HRCT was performed with the patient in the supine position during end-inspiration. The patients who were referred from wards to CT Department wore personal protective equipment (PPE) andN95 masks, as well as the CT technicians who performed CT of patients with suspected COVID-19 were required to wear protective garments. Standard CT protocol was applied with topogram length of 512 cm, 120 kV and 35 mA. Images were obtained in axial mediastinal window and reconstructed in thin 1.25 mm lung window. All CT images were reconstructed to 1.25-mm thin slices. Multiplanar images were obtained using the multiplanar reformatting (MPR) technique on a workstation. After the CT scans of all daily appointed positive patients was done, the CT department was fumigated for at least 4 hours using 20% Baccishield, followed by cleaning of CT gantry, CT table and floor by 1% hypochlorite solution and left to dry for 30 minutes.[[13]] For each patient, the chest CT scan was thoroughly evaluated for presence of opacities and lesions.[[14]] Each of the five lung lobes were assessed for degree of involvement, which was classified as none (0%), minimal (1%–25%), mild (26%–50%), moderate (51%–75%), or severe (76%–100%). No involvement corresponded to a lobe score of 0, minimal to a lobe score of 1, mild to a lobe score of 2, moderate to a lobe score of 3, and severe to a lobe score of 4. An overall lung total severity score was reached by summing the five lobe scores (range of possible scores, 0–20).[[15]]
Results
In the present study conducted, 216 cases were enrolled who fulfilled the inclusion criteria.
Highest number of cases presented were in the age group of 21–40 years (103 cases – 47.7%), followed by 0–20 years (53 cases – 24.5%), and 41–60 years (50 cases- 23.1%) [[Chart 1]]. Sevenpregnant females were excluded from the study as they did not undergo HRCT due to radiation risk to the fetus. One patient aged 72 years with co morbidities in the form of pre-existing cardiac disease and uncontrolled diabetes had severe symptoms and was put on ventilator support from the day of admission and hence could not be shifted to CT department. He was subjected to serial X-Ray Chest Examinations. This patient succumbed on Day 10 of his admission due to cardio-respiratory andmultiorgan failure. Hence, total 7 cases were excluded from our study.

The study included 136 males (63%) and 80 females (37%)[[Chart 2]]. Pediatric population affected (0–15 age group) was40 cases (18.5%).

The city of Kolhapur is situated 400 kms from Mumbai and 250 km from Pune which were worst affected districts in Maharashtra State. Many people from the city are working in these two districts and due to the extended lockdown announced by the Government, these people slowly started coming to their homes, some by illegal means and many by legal travel passes. All these people were stopped at the city entry check post and sent to different institutes for swab collection and Institutional quarantine or hospitalization based on initial clinical assessment, nearly 90% cases (195 patients) had domestic travel history mainly from Mumbai. Onepatient had traveled from Iran. Twentycases were those relatives of above 195 patients who came in contact with them at some point of time [[Table 1]].
|
Exposure |
No of Cases |
|---|---|
|
International Travel History |
1 |
|
Domestic Travel History |
195 |
|
Exposure to positive patients |
20 |
Many travelers whose nasopharyngeal swabs were tested positive for COVID infection were asymptomatic (141 cases, 65%), 60 patients (28%) had mild symptoms while 15 patients (7%) had moderate to severe symptoms[[Chart 3]].

Sore throat followed by generalized malaise, fever and cough were the common presenting symptoms. [[Table 2]].16 patients out of 75 (21.3%) were symptomatic and showed negative Chest X-ray as well as HRCT findings. These patients predominantly had mild symptoms ranging from low grade fever to cough ad sore throat as mentioned in [[Table 3]]. In our study 102 patients (47.3%) had abnormal HRCT’s while only 31 patients (14.4%) had abnormal X rays [[Table 4.1]] and [[Table 4.2]].
|
Symptoms |
No of Cases |
|---|---|
|
Fever |
35 (47%) |
|
Fever, Cough |
60 (80%) |
|
Dyspnoea |
12 (16%) |
|
Sore throat |
58 (77%) |
|
Abdominal Pain |
8 (10.6%) |
|
Generalised malaise |
36 (48%) |
|
Asymptomatic |
141 (65.27%) |
|
Category |
Definition |
No of Cases |
|---|---|---|
|
Mild |
Fever sore throat, cough SpO2>95% on room air |
60 (80%) |
|
Moderate |
Dyspnoea with Spo2 upto 85-90% on room air requiring mask O2 at 2-4 lit, IV fluids & IV antibiotics |
12 (16%) |
|
Severe |
Dyspnea at rest with non invasive or invasive ventilation requirement, &/or extrapulmonary complications |
3 (4%) |
|
Chest X Ray Normal |
Chest X ray Abnormal |
HRCT Normal |
HRCT Abnormal |
Total |
|
|---|---|---|---|---|---|
|
Asymptomatic Patients |
136 (96.5%) |
5 (3.5%) |
98 (69.5%) |
43 (30.5%) |
141 |
|
Symptomatic Patients |
49 (65.3%) |
26 (34.7%) |
16 (21.3%) |
59 (78.7%) |
75 |
|
Total |
185 (85.6%) |
31 (14.4%) |
114 (52.7%) |
102 (47.3%) |
216 |
|
Radiological Investigation |
No of Cases |
|---|---|
|
Chest X Ray & HRCT both normal |
114 (52.7%) |
|
Chest X ray & HRCT both abnormal |
31 (13.8%) |
|
HRCT abnormal but Chest X ray |
71 (32.7%) |
|
Normal |
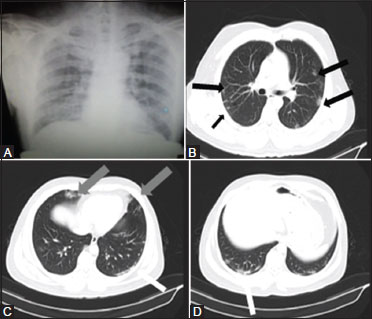
Interesting finding which was noted in our study was that 71 patients (32.7%) who had an initial normal chest X-ray showed findings on HRCT examination ranging from ground glass opacities to GGO’s with nodules [[Figure 1]] or crazy paving appearances [[Figures 2] and [3]] affecting one or multiple lobes [[Table 4]]. Based on HRCT findings and on subsequent clinical evaluation the clinicians placed these patients under close clinical monitoring and hospitalization for 14 days.


Out of 102 cases of abnormal HRCTs, 92 of them (90.2%) had bilateral lung involvement, while 8 (7.8%) had only right lung involvement and 2 (2%) had only left lung involvement [[Chart 4]].

Ground glass opacities (GGO’s) were the most common finding [[Table 5]] seen in almost all patients who showed some finding on HRCT. 94 out of 102 (92.2%) patients who showed findings on HRCT had ground glass opacities. GGO’s with septal thickening and fine fibrosis [[Figure 4]] was the next common finding seen in 55 patients. The reversed halo sign or atoll sign [[Figure 3]] was seen in 18 patients while GGO’s with consolidation [[Figure 5]] was seen in 10 patients. Nodular pattern was seen in 29 patients. Sixpatients did not have any features pertaining to viral pneumonitis but showed calcified lesions, fibrobronchiectasis and lung volume loss. In retrospect these patients were found to have past history of Pulmonary Tuberculosis, so above findings signified Koch’s sequelae. A typical peripheral and subpleural distribution of opacities was the hallmark feature of COVID infection [[Table 6]] while bilateral asymmetrical and multilobar involvement particularly of the lower lobes was a common finding [[Table 7]] and [[Table 8]].One male patient aged 54 years in our study developed spontaneous thrombosis of left subclavian artery on day 7 of his admission. His HRCT chestseverity score was 6. He underwent CT Upper limb Angiography which revealed acute thrombotic occlusion of distal subclavian artery with optimal opacification of distal limb arteries. His lab parameters showed positive d-dimer test. However, quantitative d dimer was not done. His interleukin 6 levels and serum ferritin were within normal range while ESR was raised and CRP was positive. His thrombophilia workup was negative. This patient did not have any past history of underlying cardiovascular disease. He was hypertensive and non diabetic. Patient was started on systemic thrombolysis with intravenous streptokinase in prescribed dose for 48 hours in ICU. Check CT Angiography showed complete recanalization of the thrombotic segment. Follow up HRCT Chest was performed on day 14 after follow up RT-PCR swab tested negative. HRCT showed near complete resolution [[Figure 6]]. Hence patient was discharged and sent to home quarantine as per guidelines.


|
HRCT Findings |
No of Patients |
|---|---|
|
Ground Glass Opacities (GGO’S) |
94 (92.2%) |
|
Presence Of Both GGO’s & Consolidation |
10 (9.8%) |
|
GGO’s With Septal Thickening/Crazy Paving Pattern |
55 (54%) |
|
GGO’s With Reversed Halo Or Atoll Sign |
18 (17.7%) |
|
GGO’s With Pulmonary Nodules |
29 (28.4%) |
|
Pleural Effusion |
0 |
|
Mediastinal Lymphadenopathy |
17 (16.7%) |
|
Fibrosis, Tractional Bronchiectasis, Volume Loss, Calcified Granulomas |
8 (7.8%) |
|
HRCT distribution of Opacities |
No of Patients |
|---|---|
|
Bronchocentric, Peribronchovascular |
2 |
|
Peripheral subpleural |
92 |
|
No of Lobes Involved |
No of patients |
|---|---|
|
0 |
114 |
|
1 |
7 |
|
2 |
31 |
|
3 |
18 |
|
4 |
19 |
|
5 |
27 |
|
Bilateral |
92 |
|
Lobe |
NO of cases |
|---|---|
|
Right upper lobe |
53 |
|
Left Upper Lobe |
38 |
|
Right Middle Lobe |
35 |
|
Lingular Lobe |
23 |
|
Right lower lobe |
79 |
|
Left lower lobe |
76 |
The bilateral lower lobes were the most commonly involved followed by right upper, left upper, and right middle lobes [[Table 8]].
The CT severity score directly correlated with clinical severity of disease [[Table 9]]. In our study, the 15 patients who had moderate to severe symptoms had a CT severity score in the higher range ranging from 6 to 20. Highest CT severity score assigned to 2 patents was 12 who had bilateral lower and middle lobe involvement affecting more than 75% area.Those patients with GGOs and associated consolidations or reverse halo sign (Atoll Sign) [[Figures 2] and [3]] showed longer recovery time as compared to those patients who had GGO with interstitial thickening or nodular pattern of GGOs.[[Figure 1]]. In contrast not all patients with HRCT finding of GGO’s were symptomatic.
|
CT Severity Score |
No of Patients |
|---|---|
|
0 |
114 (52.7%) |
|
1-2 |
30 (14%) |
|
3-5 |
65 (30%) |
|
6-10 |
6 (2.7%) |
|
11-20 |
1 (0.6%) |
The mortality rate of COVID-19 infection in our study was 1.3% (3 deaths out of 216 patients). These 3 deaths were seen in above 40 age group [[Table 10]]. All the 3 patients had associated co morbidities. The CT severity score of these 3 patients was above 6 with highest score being 12 out of 20. At the time of study 90 patients were discharged after full recovery and after their swabs were tested negative by RT-PCR. Hence, the recovery rate was approx. 42%.
|
Age |
No of patients with moderate to severe symptoms |
Death |
|---|---|---|
|
0-20 |
0 |
0 |
|
21-40 |
0 |
0 |
|
41-60 |
9 |
1 |
|
61-80 |
5 |
1 |
|
>80 |
1 |
1 |
|
Total |
15 |
3 |
Totally, 102 patients who had findings on their initial HRCT examination underwent follow-up HRCT [[Table 11]]. Those patients who had partial or no resolution or increase in opacities were reassessed by follow-up HRCT chest after 7 days though their swabs tested negative for COVID-19 and were discharged only when there was good radiological clearance.
|
Follow up HRCT Chest Findings done at day 10-14 |
No of Cases |
|---|---|
|
Near complete resolution of opacities 9 defined as non-visualization or faint visualization of opacities) |
79 (77.5%) |
|
Partial resolution (defined as decrease in density number and size of opacities) |
18 (17.6%) |
|
Persistent or increase in opacities |
5 (4.9%) |
Discussion
India reported an average of 6500 new cases of COVID-19 per day[[8]] since our preliminary research paper was submitted for peer review on May 31, 2020. Just as clinicians are evaluating more patients suspected of having COVID-19, radiologists are similarly interpreting more chest CT scans in those suspected of infection. Our study showed maximum infections in the age group of 20–40 (103 cases, 47.7%) which was in sync with the national trend in India.[[8]] Males had higher incidence of infection in our study with fever and cough being the most common symptoms as noted in the rest of the World.[[7]] Our study showed 141 (65%) asymptomatic cases which is a significant number and can be attributed to the demography of the district which is situated along the Mumbai–Bangalore highway and hence a large influx of imported cases of migrants and working middle class people who travelled back to their native district as soon as nationwide lockdown was being gradually weaned off. There was no local or community level transmission seen in the district till date andall the COVID-19 positive cases were imported cases. In our study 102 patients (47.3%) had abnormal HRCT’s while only 31 patients (14.4%) had abnormal X-rays [[Table 4.1]].
The Chi-square statistic is 54.76. The P value is <0.0001, significant at P < 0.05. Hence, chest HRCT scores over X-ray Chest as a preferred investigation modality for COVID 19. Other findings of this work largely concur with work by Adam B et al.[[15]] and Yan Li et al.[[16]] that demonstrated preponderance of ground-glass abnormality in early disease, followed by development of crazy paving and, finally, increasing consolidation later in the disease course insofar as this pattern of groundglass and consolidative pulmonary opacities, often with a bilateral and peripheral lung distribution, is emerging as the chest CT hallmark of COVID-19 infection as also described by Kamal Kant et al.[[17]] The findings in our study, represent the CT correlate for the underlying pathophysiology of the disease process as it organizes. Moreover, the notable absence of ancillary chest CT findings such as lymphadenopathy, pleural effusions, pulmonary nodules, and lung cavitation likewise are consistent with early case descriptions.
In this study of 216 patients with confirmed COVID-19 infection, it is noteworthy that 114 of the 216 patients (52.7%) had a normal HRCT scan with complete absence of ground-glass opacities and consolidation, suggesting that realtime RT-PCR is positive even in patients with normal chest CT scans. Chest CT therefore cannot be used as a reliable standalone tool to rule out COVID-19 infection. These findings do not concur with a large study of cases carried out by Yiecheng F et al.[[18]]and Tao Ae et al.[[19]] wherein they proposed to utilize HRCT as a surveillance tool to detect COVID-19 patients owing to its high sensitivity of 98% in their study. We still believe that RT-PCR may be more reliable tool for mass screening and diagnosis of COVID-19, while the role of HRCT would be established in the country as a modality to triage patients, when the community level transmission of COVID infection occurs.
All the patients in our study underwent follow-up HRCT between 10th to 14th day of their admission after their follow up swab tested negative for COVID-19 on RT-PCR study. In our study, only 102/216 (47.3%) patients confirmed by RT-PCR assays showed positive findings on chest CT, which was much lower than that reported by Xie X et al.(76.4%).[[20]] A likely explanation is that patients in this study were majority travelers from the city of Mumbai which was country’s prime COVID hotspot with possible community level transmission of disease leading to number of subclinical infection cases.
Pan et al.[[21]]demonstrated that multiple re-examinations of chest CT can accurately reflect the disease evolution and monitor the treatment effect. We also observed 77.5% (79/102) of patients showed improvement on follow-up chest CT scans, done after RT-PCR results turning negative, while 17.6% (18/102 patients) showed persistence of opacities and 4.5% (5/102) of patients showed progression of disease on follow up. [[Figures 2] and [3]].Thus, HRCT is a very effective tool to monitor the prognosis of patients as radiological clearance of opacities may not be achieved in all patients whose follow-up swabs test negative suggesting persistence of infection and these patients may need further hospitalization and continuation of treatment. Furthermore, initial CT severity score may give an idea of the severity of infection and aggressive management protocols may be initiated by treating clinicians so as to prevent the morbidity and mortality associated with the disease. The low patient mortality rate in our study -1.3% (3 deaths out of 216 patients) as compared to the national mortality rate of 3.6% and global mortality rate of approximately 6% as per WHO situation report[[7]]can be attributed to the better clinico-radiological correlation which led to aggressive clinical monitoring and treatment of patients with higher CT severity scores. Hence, Chest CT is vital component in the diagnostic algorithm for patients suspected of having COVID-19 infection and should be used with increasing frequency, as also outlined by Kohli A[[22]] in their study.
There are several limitations of this study. This study being a retrospective study done in already diagnosed COVID cases, hence it cannot be utilized in calculating the exact sensitivity and specificity of HRCT in making a diagnosis of COVID 19 infection. There is no comparison between RT-PCR and HRCT in diagnosing coronavirus infection. As our intention to publish the study was to familiarize radiologists with HRCT findings in COVID infection and underline its role in prognosis, the sample size of the study is relatively smaller. Meanwhile, the outbreak is at a stage of evolving from the acute to a more subacute phase in many patients. Recognizing imaging patterns based on infection time course is paramount for not only understanding the pathophysiologic features and natural history of infection, but also for helping to predict patient progression and potential complication development. Eventually, as infection duration in a large number of patients extends from the acute and subacute phases to either a completely healed outcome or to a chronic phase in patients over the coming several weeks and months, future investigators may evaluate imaging findings in the chronic phase. Such work could evaluate if long-term complications absent in this study (e.g., pleural effusions, empyema, lymphadenopathy, and lung cavitation) potentially arise.
Thus, to summarize, a typical pattern of peripheral subpleural more often bilateral and asymmetrical distribution of lung opacities is becoming the hallmark of COVID infection related pneumonias on HRCT and should help Radiologists to diagnose COVID pneumonias with increasing confidence.HRCT Chest should be increasingly used in COVID 19 pandemic as it definitely has a greater role to play in evaluating the disease severity at presentation and subsequent prognosis of the disease. HRCT Chest examinations done during the course of disease aids in patient management and a better clinico-radiological correlation would benefit in further reducing the mortality rate associated with COVID-19 infection. Whether HRCT scores over RT-PCR as a mass screening tool is a matter of further research and discussion, however with increasing number of subclinical cases in the community as the disease is progressing into community level transmission, RT-PCR should be presently considered as a gold standard test to identify subclinical cases.
Declaration of patient consent
The authors certify that they have obtained all appropriate patient consent forms. In the form the patient(s) has/have given his/her/their consent for his/her/their images and other clinical information to be reported in the journal. The patients understand that their names and initials will not be published and due efforts will be made to conceal their identity, but anonymity cannot be guaranteed.
Conflict of Interest
There are no conflicts of interest.
Acknowledgement
Dept of Microbiology, Dept of Medicine, Dept of TB & Chest, RCSM Government Medical College, Kolhapur.
-
References
- 1 Zhu N, Zhang D, Wang W, Li X, Yang B, Song J. et al. A novel coronavirus from patients with pneumonia in China, 2019. N Engl J Med 2020; 382: 727-33
- 2 Tan WJ, Zhao X, Ma XJ, Wang W, Niu P, Xu W. et al. A novel coronavirus genome identified in a cluster of pneumonia cases - Wuhan, China 2019-2020. China CDC Wkly 2020; 2: 61-2
- 3 Chan JF-W, Yuan S, Kok K-H, To KK-W, Chu H, Yang J. et al. A familial cluster of pneumonia associated with the 2019 novel coronavirus indicating person-to-person transmission: A study of a family cluster. Lancet 2020; 395: 514-23
- 4 Huang C, Wang Y, Li X, Ren L, Zhao J, Hu Y. et al. Clinical features of patients infected with 2019 novel coronavirus in Wuhan, China. Lancet 2020; 395: 497-506
- 5 Phan LT, Nguyen TV, Luong QC, Nguyen TV, Nguyen HT, Le HQ. et al. Importation and human-to-human transmission of a novel coronavirus in Vietnam. N Engl J Med 2020; 382: 872-4
- 6 Li Q, Guan X, Wu P, Wang X, Zhou L, Tong Y. et al. Early transmission dynamics in Wuhan, China, of novel coronavirus-infected pneumonia. N Engl J Med 2020; 382: 1199-207
- 7 Situation Report - 28. World Health Organization. Published February 17, 2020. Available
from: https://www.who.int/docs/default-source/coronaviruse/situationreports/20200217-sitrep-28-covid-19.pdf?sfvrsn=a19cf2ad_2.
[Last accessed on 2020 Apr 30].
MissingFormLabel
- 8 Available from: http://www.mygov.in/covid-19. [Last accessed on 2020 May 31].
MissingFormLabel
- 9 Wang W, Tang J, Wei F. Updated understanding of the outbreak of 2019 novel coronavirus (2019-nCoV) in Wuhan, China. J Med Virol 2020; 92: 441-7
- 10 Wang C, Horby PW, Hayden FG, Gao GF. A novel coronavirus outbreak of global health concern. Lancet 2020; 395: 470-3
- 11 Mahase E. China coronavirus: WHO declares international emergency as death toll exceeds 200. BMJ 2020; 368: m408
- 12 Lam CW, Chan MH, Wong CK. Severe acute respiratory syndrome: Clinical and laboratory manifestations. ClinBiochem Rev 2004; 25: 121-32
- 13 Mossa-Basha M, Medverd J, Linnau K, Lynch JB, Wener MH, Kicska G. et al. Plicies and guidelines for COVID-19 preparedness: Experiences from the University of Washington. Radiology 2020; 296: E26-31
- 14 Hansell DM, Bankier AA, MacMahon H, McLoud TC, Müller NL, Remy J. Fleischner Society: Glossary of terms for thoracic imaging. Radiology 2008; 246: 697-722
- 15 Bernheim A, Mei X, Huang M, Yang Y, Fayad ZA, Zhang N. et al. Chest CT findings in coronavirus disease 2019 (COVID-19): Relationship to duration of infection. Radiology 2020; 295: 685-91
- 16 Li Y, Xia L. Coronavirus disease 2019 (COVID-19): Role of chest CT in diagnosis and management. AJR Am J Roentgenol 2020; 214: 1280-6
- 17 Sahu KK, Lal A, Mishra AK. An update on CT chest findings in coronavirus disease-19. Heart Lung 2020; 49: 442-3
- 18 Fang Y, Zhang H, Xie J, Lin M, Ying L, Pang P. et al. Sensitivity of chest CT for COVID-19: Comparison to RT-PCR. Radiology 2020; 296: E115-7
- 19 Ai T, Yang Z, Hou H, Zhan C, Chen C, Lv W. et al. Correlation of chest CT & RT-PCR testing in corona virus disease 2019 (COVID-19) in China: A report of 1014 Cases. Radiology 2020; 296: E32-40
- 20
Xie X,
Zhong Z,
Zhao W,
Zheng C,
Wang F,
Liu J.
Chest CT for typical 2019-nCoV pneumonia: Relationship to negative RT-PCR testing.
Radiology 2020:200343. doi: doi: 10.1148/radiol. 2020200343.
MissingFormLabel
- 21 Pan F, Ye T, Sun P, Gui S, Liang B, Li L. et al. Time Course of Lung Changes at Chest CT during Recovery from Coronavirus Disease 2019 (COVID-19). Radiology 2020; 295: 715-21
- 22 Kohli A. Can imaging impact the coronavirus pandemic?. Indian J Radiol Imaging 2020; 30: 1-3
Address for correspondence
Publication History
Received: 09 June 2020
Accepted: 08 September 2020
Article published online:
13 July 2021
© 2021. Indian Radiological Association. This is an open access article published by Thieme under the terms of the Creative Commons Attribution-NonDerivative-NonCommercial-License, permitting copying and reproduction so long as the original work is given appropriate credit. Contents may not be used for commercial purposes, or adapted, remixed, transformed or built upon. (https://creativecommons.org/licenses/by-nc-nd/4.0/).
Thieme Medical and Scientific Publishers Private Ltd.
A-12, Second Floor, Sector -2, NOIDA -201301, India
-
References
- 1 Zhu N, Zhang D, Wang W, Li X, Yang B, Song J. et al. A novel coronavirus from patients with pneumonia in China, 2019. N Engl J Med 2020; 382: 727-33
- 2 Tan WJ, Zhao X, Ma XJ, Wang W, Niu P, Xu W. et al. A novel coronavirus genome identified in a cluster of pneumonia cases - Wuhan, China 2019-2020. China CDC Wkly 2020; 2: 61-2
- 3 Chan JF-W, Yuan S, Kok K-H, To KK-W, Chu H, Yang J. et al. A familial cluster of pneumonia associated with the 2019 novel coronavirus indicating person-to-person transmission: A study of a family cluster. Lancet 2020; 395: 514-23
- 4 Huang C, Wang Y, Li X, Ren L, Zhao J, Hu Y. et al. Clinical features of patients infected with 2019 novel coronavirus in Wuhan, China. Lancet 2020; 395: 497-506
- 5 Phan LT, Nguyen TV, Luong QC, Nguyen TV, Nguyen HT, Le HQ. et al. Importation and human-to-human transmission of a novel coronavirus in Vietnam. N Engl J Med 2020; 382: 872-4
- 6 Li Q, Guan X, Wu P, Wang X, Zhou L, Tong Y. et al. Early transmission dynamics in Wuhan, China, of novel coronavirus-infected pneumonia. N Engl J Med 2020; 382: 1199-207
- 7 Situation Report - 28. World Health Organization. Published February 17, 2020. Available
from: https://www.who.int/docs/default-source/coronaviruse/situationreports/20200217-sitrep-28-covid-19.pdf?sfvrsn=a19cf2ad_2.
[Last accessed on 2020 Apr 30].
MissingFormLabel
- 8 Available from: http://www.mygov.in/covid-19. [Last accessed on 2020 May 31].
MissingFormLabel
- 9 Wang W, Tang J, Wei F. Updated understanding of the outbreak of 2019 novel coronavirus (2019-nCoV) in Wuhan, China. J Med Virol 2020; 92: 441-7
- 10 Wang C, Horby PW, Hayden FG, Gao GF. A novel coronavirus outbreak of global health concern. Lancet 2020; 395: 470-3
- 11 Mahase E. China coronavirus: WHO declares international emergency as death toll exceeds 200. BMJ 2020; 368: m408
- 12 Lam CW, Chan MH, Wong CK. Severe acute respiratory syndrome: Clinical and laboratory manifestations. ClinBiochem Rev 2004; 25: 121-32
- 13 Mossa-Basha M, Medverd J, Linnau K, Lynch JB, Wener MH, Kicska G. et al. Plicies and guidelines for COVID-19 preparedness: Experiences from the University of Washington. Radiology 2020; 296: E26-31
- 14 Hansell DM, Bankier AA, MacMahon H, McLoud TC, Müller NL, Remy J. Fleischner Society: Glossary of terms for thoracic imaging. Radiology 2008; 246: 697-722
- 15 Bernheim A, Mei X, Huang M, Yang Y, Fayad ZA, Zhang N. et al. Chest CT findings in coronavirus disease 2019 (COVID-19): Relationship to duration of infection. Radiology 2020; 295: 685-91
- 16 Li Y, Xia L. Coronavirus disease 2019 (COVID-19): Role of chest CT in diagnosis and management. AJR Am J Roentgenol 2020; 214: 1280-6
- 17 Sahu KK, Lal A, Mishra AK. An update on CT chest findings in coronavirus disease-19. Heart Lung 2020; 49: 442-3
- 18 Fang Y, Zhang H, Xie J, Lin M, Ying L, Pang P. et al. Sensitivity of chest CT for COVID-19: Comparison to RT-PCR. Radiology 2020; 296: E115-7
- 19 Ai T, Yang Z, Hou H, Zhan C, Chen C, Lv W. et al. Correlation of chest CT & RT-PCR testing in corona virus disease 2019 (COVID-19) in China: A report of 1014 Cases. Radiology 2020; 296: E32-40
- 20
Xie X,
Zhong Z,
Zhao W,
Zheng C,
Wang F,
Liu J.
Chest CT for typical 2019-nCoV pneumonia: Relationship to negative RT-PCR testing.
Radiology 2020:200343. doi: doi: 10.1148/radiol. 2020200343.
MissingFormLabel
- 21 Pan F, Ye T, Sun P, Gui S, Liang B, Li L. et al. Time Course of Lung Changes at Chest CT during Recovery from Coronavirus Disease 2019 (COVID-19). Radiology 2020; 295: 715-21
- 22 Kohli A. Can imaging impact the coronavirus pandemic?. Indian J Radiol Imaging 2020; 30: 1-3