

Subscribe to RSS
DOI: 10.4103/ijri.IJRI_130_20
Accuracy of radiologists, nonradiologists, and laypeople for identifying children with cerebral cortical atrophy from “Mercator map” curved reconstructions of MRIs of the brain
Authors
Financial support and sponsorship Nil.


Abstract
Background: Using text reports to communicate bilateral, symmetric, and zonal cortical brain atrophy in children with term hypoxic ischemic injury (HII) to parents and legal professionals contesting compensation rights can be difficult. Using standard cross-sectional images for explaining bilateral, regional brain imaging to laypeople is also challenging. A single flattened image of the brain surface, much like a map of the earth is derived from a globe, can be generated from curved reconstruction of magnetic resonance imaging (MRI) scans, i.e., a Mercator map. Laypeople’s ability to identify abnormal “Mercator brain maps,” without prior training, requires evaluation before use in nonmedical settings. Aim: To determine the sensitivity and specificity of laypeople in detecting abnormal pediatric Mercator flat-earth maps of the brain, without prior training. Methods and Materials: 10 Mercator brain maps were provided to 111 participants individually. The maps comprised 5 HII, 1 cortical dysplasia, and 4 normal cases. Participants were required to identify the abnormal scans. Sensitivity and specificity overall and for participants’ subgroups were calculated. Results: Overall sensitivity and specificity were 67% and 80%, respectively. General radiologists (n = 12) had sensitivity and specificity of 91.2% and 94.6%, respectively. Laypeople (n = 54) had a sensitivity of 67% and specificity of 80%. Conclusion: The high specificity and sensitivity of radiologists validated the technique for distinguishing abnormal scans, regarding cortical pathology. High specificity of laypeople for identifying abnormal brains using Mercator maps indicates that this is a viable communication tool for demonstrating cortical MRI abnormalities of HII in children to laypersons.
Keywords
Cerebral cortical atrophy - curved reconstructions - HII - hypoxic ischemic injury - laypeople - Mercator map - MRIIntroduction
Communication of bilateral, symmetric, and zonal cortical brain atrophy in children with term hypoxic ischemic injury to parents and the legal fraternity contesting compensation rights using text reports of the magnetic resonance imaging (MRI) can be very difficult. Attempting to use standard cross-sectional images for explaining brain imaging findings to laypeople is also challenging because these demonstrate detailed internal anatomy of the brain in slices, oriented in varying planes. In cognitive neuroscience, the use of actual brain images to demonstrate function has been shown to influence the credibility of findings, more than with reports only.[[1]]
When needing to demonstrate bilateral symmetrical disease affecting the cortex in hypoxic ischemic injury, a single flattened image of the brain surface, much like the way a map of the earth is derived from a globe, is useful as it provides an overview of surface pathology. These can be generated from curved reconstruction of coronal MRI scans, i.e., a Mercator map as published previously[[2], [3]] [[Figure 1A] and [B]]. Laypeople’s ability to identify abnormal scans from such maps, without prior training, requires evaluation before use in nonmedical settings. Because controversies exist in using some types of neuro-imaging in courtrooms,[[4]] the use of new techniques for communicating with both medical and nom-medical staff has to be tested and must also gain acceptance.

Aim
To determine the sensitivity and specificity of nonradiologists (especially laypeople) in detecting abnormal brain scans through review of Mercator flat-earth maps of the brain in children, without any prior training.
Methods and Materials
A previously conceived and published standardized method of generating flat-earth “Mercator maps” was performed through curved reformatting of 10 coronal MRI images of the brain in children.[[5]] “Mercator maps” are “flattened” images generated from the whole surface of the “oval”-shaped human brain, just as a geographic map is a “flattened” representation of the earth’s surface, derived from an oval globe of the earth [[Figure 1]].
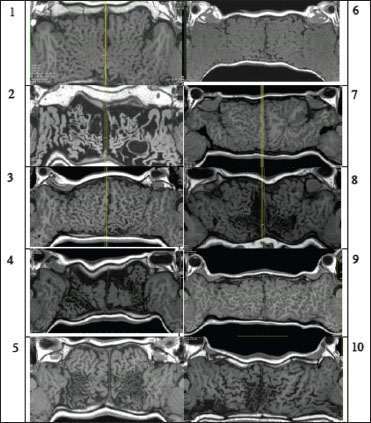
The total of 10 MRI scans that were selected included 5 children of varying ages who had suffered partial prolonged hypoxic ischemic injury (HII) at term, one child with peri-Sylvian cortical dysplasia, and 4 children with “normal” MRI reports. JPEG versions of the “Mercator maps” created from the MRI scans were placed randomly into a grid and numbered from 1–10 for viewing on a standard computer screen [[Figure 2]].
Participants were recruited from immediate hospital clinical and research environment of the primary investigators to review the images. These included laypeople (nonmedical trained) (cleaning, administrative, secretarial staff), nonradiologist medical personnel (radiographers, physicians, scientists), and general radiologists. There were 111 participants: 54 laypeople, 45 nonradiologist medical and paramedical staff (36 radiographers, 3 physicians, and 1 neuroscientist), and 12 radiologists.
The participants were shown an image of a world map being derived from a globe of the earth and it was explained that the radiological images of the brain shown represented the brain which had been flattened out for viewing of the complete surface in much the same way. This was likened to an orange peel being removed and laid flat for viewing the entire external surface of the orange, in one view. Participants were not provided with any image interpretation training or any clinical information.
The participants were shown the entire grid [[Figure 2]] of the 10 Mercator maps (simultaneously) and asked to use their own intuition or logic to indicate only the brain images which they thought with a certain degree of confidence were abnormal. These were recorded and sensitivity and specificity of the whole group and subgroups of participants were derived by averaging the true positives, true negatives, false positives, and false negatives of the overall group and of the different subgroups of participants.
Ethical approval for this work was obtained from the Faculty of Science Human Research Ethics Committee of the University of Bristol.
Results
Data was tabulated in an Excel spreadsheet for each participant for each case. If selected, the case received a score of 1 and if not selected, the case received a score of 0. Overall numbers or totals were obtained per case and for the entire group. Sensitivity and specificity calculations were made using standard methods using true positives (TP), true negatives (TN), false positives (FP), and false negatives (FN). Pis defined as the total number of positives and N the total number of negatives.
Sensitivity was calculated as TP/P or TP/(TP+FN). Specificity was calculated as TN/N or TN/(TN+FP). Of the 111 participants, the overall sensitivity was 66% and the overall specificity was 84%. Radiologists (n = 12) showed the highest sensitivity and specificity of 91% and 95%, respectively.
Subgroup analysis was then performed for each of radiographers, nonradiologist physicians, nursing staff and laypeople. Radiographers (n = 36) participated and had a sensitivity and specificity of 60% and 85%, respectively. Nonradiologist physicians (n = 4) had a sensitivity of 75% and a specificity of 88%. Nursing staff (n = 5) had a poor sensitivity of only 30% and a very high specificity of 94%. Laypeople (nonmedical trained) (n = 54) had a sensitivity of 67% and a specificity of 80%.
Discussion
Curved reformatting of the brain
A method for improved display of brain surface anatomy using curved reconstructions of MRI was described by Bastos et al. in 1995[[2]] who demonstrated focal cortical dysgenesis better on the curved reconstructions than on standard multi-planar imaging. Subsequent publications have used the “Mercator” view to depict surface lesions,[[3]] and sulcal patterns have been used to define gyral anatomy.[[6]] These displays can demonstrate bilateral and geographic/zonal cortical involvement to an advantage, because both sides of the brain surface are demonstrated simultaneously on a single image [[Figure 3]].

Hypoxic ischemic injury in term neonates
Characteristic cortical abnormalities in hypoxic ischemic injury (HII) sustained at term depend on both the severity and duration of the hypoxic ischemic insult. Delayed imaging demonstrates atrophy of the affected regions. In “acute near total asphyxia” at term, cortical abnormality is seen in the peri-Rolandic regions (in addition to the ventrolateral thalami and posterior putamina). Less severe, “partial prolonged asphyxia,” in term infants, results in volume loss with ulegyria (mushroom-shaped gyri) in the parasagittal and other watershed zones of perfusion.[[7], [8]] The key feature of global insults is that they result in damage that is bilateral and “symmetric.” The “flat-earth” or “Mercator map” solution gives an excellent overview of the regions of cortex that are most commonly affected in HII, allowing the resultant bilateral atrophy and characteristic ulegyria to be visualized simultaneously.
Laypeople in medicine
There are several groups of people with a professional or personal interest in the radiology report in cases of HII. These include neonatologists and neurologists (who often understand the radiological descriptions) and other generalists such as family physicians or pediatricians (who may not have any understanding of the radiologic reports). Another group who need to understand the radiology report are legal professionals: judges and lawyers assessing compensation claims in the cases of alleged birth asphyxia. While this group may know the terminology used in cases of HII, it is unlikely that they can build a mental picture from three orthogonal planes in the way that a radiologist can. Finally, the parents of children who have suffered brain injury must gain clarity about their child’s condition, but the traditional MRI report, couched in complex terminology, may be difficult to understand.
Keeping in mind that there were no subspecialist neuro-radiologists on the panel or any medico-legal experts, the high accuracy of general radiologists (with some pediatric radiologists) in both sensitivity and specificity validates the Mercator maps as a useful additional tool for MRI brain analysis and particularly in demonstrating the intended cortical pathology.
In general, radiologists had no trouble distinguishing between pathology and normal using the provided images. The radiologists did not perform perfectly, because some correctly identified the cortical dysplasia as pathologic also, while others did not. This was thought to be due to the subtle nature of the pathology with regards to the one image which showed the cortical dysplasia rather than through any fault of display of the cortex.
The nonradiologist medical group comprised participants (radiographers, neuroscientists, and physicians) who could have had either prior training or exposure to diagnostic imaging and who may have had some understanding of cross-sectional orientation and anatomy. They would be expected to at least be able to compare the images on the grid with each other and possibly differentiate the normal or abnormal cases.
The laypeople performed almost equally to the non-radiologist medical group despite having no medical training in imaging techniques, pathology, or anatomy. Laypeople possibly have exposure to cross-sectional imaging through the media, through their own personal experiences, and (as in this group) because they have been working in radiology and neuroscience research departments. The flat-earth technique is not widely in use currently, having only been first published for HII in 2016 in a niche pediatric radiology journal,[[5]] and it is unlikely any of the participants had seen or read about this previously.
The findings of this study bode well for use of a novel technique in the legal setting where the imaging would be introduced to the audience de novo and relating to the specific child in question. The audience would not be required to identify the pathology themselves but would be guided through the imaging findings in comparison to imaging from a normal scan. Our results support the use of “flat-earth” or “Mercator map” for demonstrating cortical changes in HII, in that there appears to be intuitive ability to detect the bilateral symmetric atrophy involving the watershed regions. One difference of this testing technique from radiologic reporting practice is that the images were presented as a grid of imaging where normal and abnormal scans were placed along-side each other so that the participants could select out the abnormal scans, by being able to compare against the other imaging in the grid. Thus, our findings support presenting the pathologic cases against an age-matched control (from an image bank) for best appreciation of the findings. The practice is well recognized (even though largely abandoned) in traditional pediatric radiology practice where images of contralateral limbs were performed routinely for differentiating fractures from immature skeletal structures.
The previous work has shown that clinicians value “embedded images” within a radiology report.[[9]] Including the flat-earth map into a report would provide an elegant solution which could be easily understood by generalists, legal experts, or judges and may be used to discuss the MRI findings with parents. Use of the maps may avoid the need for cumbersome multi-image viewing and manipulation during a delicate discussion, and a copy of the set of images described above can be taken home.
Conclusion
The high specificity and sensitivity of radiologists validate the Mercator map technique in distinguishing abnormal MRI scans from normal ones, regarding cortical pathology. The results also show a strong ability for laypeople to identify abnormal MRI brain studies using Mercator maps. Therefore, the Mercator map is a viable tool in the communication of complex MR imaging to the layperson.
Conflict of Interest
There are no conflicts of interest.
-
References
- 1 McCabe DP, Castel AD. Seeing is believing: The effect of brain images on judgments of scientific reasoning. Cognition 2008; 107: 343-52
- 2 Bastos AC, Korah IP, Cendes F, Melanson D, Tampieri D, Peters T. et al. Curvilinear reconstruction of 3D magnetic resonance imaging in patients with partial epilepsy: A pilot study. Magn Reson Imaging 1995; 13: 1107-12
- 3 Hattingen E, Good C, Weidauer S, Herminghaus S, Raab P, Marquardt G. et al. Brain surface reformatted images for fast and easy localization of perirolandic lesions. J Neurosurg 2005; 102: 302-10
- 4 Schafi N. Neuroscience and Law: The evidentiary value of brain imaging. Graduate Stud J Psychol 2009; 11: 27-39
- 5 Simpson E, Andronikou S, Vedajallam S, Chacko A, Thai NJ. Curved reformat of the paediatric brain MRI into a ‘flat-earth map’ — standardised method for demonstrating cortical surface atrophy resulting from hypoxic–ischaemic encephalopathy. Pediatr Radiol 2016; 46: 1482-8
- 6 Wagner M, Jurcoane A, Hattingen E. The U Sign: Tenth landmark to the central region on brain surface reformatted MR imaging. Am J Neuroradiol 2013; 34: 323-6
- 7 de Vries LS, Groenendaal F. Patterns of neonatal hypoxic-ischaemic brain injury. Neuroradiology 2010; 52: 555-66
- 8 Huang BY, Castillo M. Hypoxic-ischemic brain injury: Imaging findings from birth to adulthood. Radiographics 2008; 28: 417-39 quiz 617
- 9 Iyer VR, Hahn PF, Blaszkowsky LS, Thayer SP, Halpern EF, Harisinghani MG. Added value of selected images embedded into radiology reports to referring clinicians. J Am Coll Radiol 2010; 7: 205-10
Address for correspondence
Publication History
Received: 22 February 2019
Accepted: 16 January 2020
Article published online:
19 July 2021
© 2020. Indian Radiological Association. This is an open access article published by Thieme under the terms of the Creative Commons Attribution-NonDerivative-NonCommercial-License, permitting copying and reproduction so long as the original work is given appropriate credit. Contents may not be used for commercial purposes, or adapted, remixed, transformed or built upon. (https://creativecommons.org/licenses/by-nc-nd/4.0/).
Thieme Medical and Scientific Publishers Private Ltd.
A-12, Second Floor, Sector -2, NOIDA -201301, India
-
References
- 1 McCabe DP, Castel AD. Seeing is believing: The effect of brain images on judgments of scientific reasoning. Cognition 2008; 107: 343-52
- 2 Bastos AC, Korah IP, Cendes F, Melanson D, Tampieri D, Peters T. et al. Curvilinear reconstruction of 3D magnetic resonance imaging in patients with partial epilepsy: A pilot study. Magn Reson Imaging 1995; 13: 1107-12
- 3 Hattingen E, Good C, Weidauer S, Herminghaus S, Raab P, Marquardt G. et al. Brain surface reformatted images for fast and easy localization of perirolandic lesions. J Neurosurg 2005; 102: 302-10
- 4 Schafi N. Neuroscience and Law: The evidentiary value of brain imaging. Graduate Stud J Psychol 2009; 11: 27-39
- 5 Simpson E, Andronikou S, Vedajallam S, Chacko A, Thai NJ. Curved reformat of the paediatric brain MRI into a ‘flat-earth map’ — standardised method for demonstrating cortical surface atrophy resulting from hypoxic–ischaemic encephalopathy. Pediatr Radiol 2016; 46: 1482-8
- 6 Wagner M, Jurcoane A, Hattingen E. The U Sign: Tenth landmark to the central region on brain surface reformatted MR imaging. Am J Neuroradiol 2013; 34: 323-6
- 7 de Vries LS, Groenendaal F. Patterns of neonatal hypoxic-ischaemic brain injury. Neuroradiology 2010; 52: 555-66
- 8 Huang BY, Castillo M. Hypoxic-ischemic brain injury: Imaging findings from birth to adulthood. Radiographics 2008; 28: 417-39 quiz 617
- 9 Iyer VR, Hahn PF, Blaszkowsky LS, Thayer SP, Halpern EF, Harisinghani MG. Added value of selected images embedded into radiology reports to referring clinicians. J Am Coll Radiol 2010; 7: 205-10