

Subscribe to RSS
DOI: 10.1055/s-0045-1814088
Assessing the Parameter—Vessel-to-Lesion-Specific Perivascular Fat Attenuation Ratio, as a New Imaging Marker of High Risk Plaques
Authors


Abstract
Background
The perivascular fat attenuation has emerged as a novel imaging biomarker of coronary artery inflammation in recent years. The present study assessed the role of lesion-specific perivascular fat attenuation (l-PVFA) and vessel-to-l-PVFA ratio (v/l- PVFAR) in plaque characterization and identifying the vulnerable/high risk plaques (HRPs) using computed tomography (CT) coronary angiogram.
Objectives
(1) To establish the significance of l-PVFA and v/l- PVFAR in the characterization of different types of plaques. (2) v/l PVFAR as a new imaging marker in the identification of HRPs.
Methods and Results
Thirty participants underwent CT coronary angiogram and we studied 70 diseased coronary arteries in these patients. Out of the 70 plaques studied retrospectively, 40 were calcified, 23 were partially calcified, and 7 were noncalcified plaques. l-PVFA and v/l PVFAR were calculated manually for different types of plaques and found significantly higher in noncalcified and partially calcified plaques, when compared with calcified plaques (p < 0.001). v/l PVFAR of > 2 is highly sensitive (100%) and specific (95.2%) for HRP with the diagnostic accuracy of 96.67%.
Conclusion
l-PVFA and v/l PVFAR highly correlate with various types of plaques. v/l- PVFAR is a useful biomarker in the identification of HRPs.
Introduction
Computed tomography (CT) coronary angiography (CTCA) is a noninvasive and effective alternative to invasive catheter coronary angiography (CAG) for the assessment of coronary artery disease and stenosis grading.[1] The introduction of helical CT in the 1990s ushered in the era of CTCA. The late 1990s saw significant advancements in spatial and temporal resolution with the emergence of multislice helical CT scanners. Since the late 2000s, improvements in technology have contributed to the growing acceptance of CTCA as a noninvasive imaging option. The current trend in coronary artery imaging is shifting from simply assessing stenosis to evaluating plaque burden and its characteristics. In the future, CTCA may serve as a comprehensive noninvasive study for both anatomical and functional evaluations.[1] [2] [3] [4] [5]
In the early 2010s, CT scans were primarily recommended for patients deemed to have a low pretest risk for coronary artery disease (CAD) according to the National Institute for Health and Care Excellence (NICE) Clinical Guideline 95 (CG95). However, recent guidelines from the European Society of Cardiology,[6] NICE,[7] and the New American College of Cardiology/American Heart Association Chest Pain Guideline[8] now recommend CT as a first-line test (class I) for both acute and chronic coronary syndromes. Symptomatic patients with stable symptoms and an intermediate or high pretest probability of obstructive CAD, as well as those with intermediate-risk acute chest pain, are also considered for CTCA as the preferred imaging method. In 2016, the Coronary Artery Disease Reporting and Data System (CAD-RADS) was introduced as a standardized classification system for coronary artery stenosis, with CAD-RADS 2.0 published in 2022. This updated version incorporates assessments of plaque burden, ischemia evaluation, and redefines vulnerable plaque as high-risk plaque (HRP).[9] Plaque burden indicates the total amount of plaque in the coronary arteries, which is strongly linked to the incidence of coronary heart disease events and has significant prognostic value. CCTA's unique ability to detect both the presence and quantity of plaque burden distinguishes it from other invasive and noninvasive tests.[9]
Materials and Methods
Patient Selection
This retrospective study was conducted for a period of 1 year 6 months from March 2022 to August 2023 and was approved by Institutional Ethics Committee, Meenakshi Hospital, Tanjore, Tamil Nadu, India (ID No. ECR/946/Inst/TN/2017/RR-21). Thirty participants underwent CT coronary angiogram and we studied 70 diseased coronary arteries in these patients.
The different types of plaques were spotted and composition is differentiated by artificial intelligence (AI)-based Hounsfield units (HU). We also assessed lesion-specific and vessel-to-lesion-specific perivascular fat attenuation (v/l-PVFA) parameters. We also correlated v/l-PVFA ratio (v/l-PVFAR) for different types of plaques and their accuracy in detecting HRPs.
We have excluded patients with coronary artery bypass grafting, patients on immunosuppressant, pericardial effusion, contraindications for β-blockers (e.g., bronchial asthma), and signs of mediastinal inflammation.
Imaging Protocol and Analysis
All patients underwent scanning using a GE Revolution Maxima 128-slice CT scanner in the prospective electrocardiogram-gated sequential mode, with a tube voltage of 120 kV and a gantry rotation time of 0.35 seconds. Initially, a noncontrast CT angiography (CTA) was performed to assess the calcium score, captured at 75% of the R-R interval. For some patients, an intravenous β-blocker was administered slowly to achieve a target heart rate of < 70 beats per minute. Subsequently, a contrast-enhanced CTA was conducted with the intravenous administration of 60 to 90 mL of iodinated contrast medium (iopromide, Ultravist 370 mg I/mL, Bayer HealthCare), followed by a 20-mL saline chaser (0.9% NaCl). The injection flow rate was weight-based, set at 5 to 6 mL/s. Bolus tracking was used to initiate the coronary CTA acquisition, with a trigger threshold of 140 HU at 90 kV in the ascending aorta. Image reconstruction was performed using the advanced ADW 4.7 Workstation equipped with built-in AI processing capabilities.
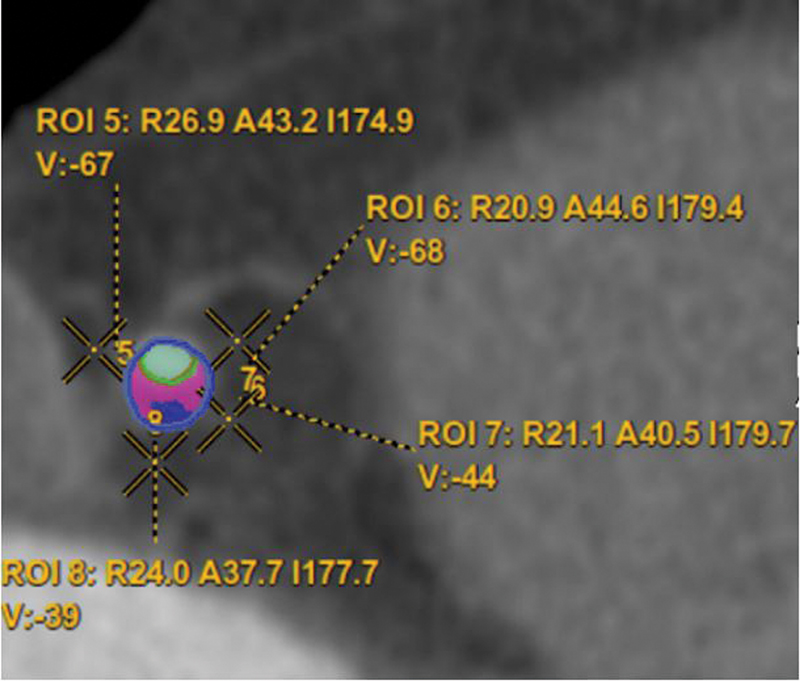
The plaques are characterized based on HU with multiple parameters like calcification, soft tissue and necrotic/fat components, and with different color codes. The PVFA was calculated manually adjacent to the lesion (referred as l-PVFA with four values and mean average is calculated) ([Fig. 1]). Similarly, at the level of normal-appearing coronary artery (referred as vessel-specific PVFA with four values and mean average is calculated) ([Fig. 2]). The ratio is calculated between v/l-PVFAR) from mean average values.

Statistical Analysis
Statistical analyses were performed using SPSS version 26 and the Epi Info statistical package, version 7. Continuous variables were expressed as mean (standard deviation), while categorical variables were presented as counts (percentages). Associations between categorical variables were evaluated using the chi-square test and Fisher's exact test, as appropriate. One-way analysis of variance was employed to determine the significance of differences between groups. A p-value of < 0.05 was considered statistically significant.
Results
The Coronary Artery Disease Reporting and Data System (CAD-RAD) scoring among the 30 participants were: 5 (CAD-RADS 1), 7 (CAD-RADS 2), 10 (CAD-RADS 3), 6 (CAD-RADS 4), and 2 (CAD-RADS 5) ([Table 1]). Out of the 70 plaques studied retrospectively, 40 were calcified, 23 were partially calcified, and 7 were noncalcified plaques. Among them, 19 were diagnosed as HRPs ([Table 2]). l-PVFA and v/l-PVFAR were significantly higher in noncalcified and partially calcified plaques, when compared with calcified plaques (p < 0.001) ([Table 3]). l-PVFA and v/l-PVFAR were significantly higher in HRP (p < 0.001) ([Table 4]). v/l-PVFAR of ≥ 2 is highly sensitive (100%) and specific (95.2%) for HRP with the diagnostic accuracy of 96.67% ([Table 5]). Representative images are attached ([Figs. 3] [4] [5] [6] [7]).
Abbreviation: CAD-RADS, Coronary Artery Disease Reporting and Data System.
Abbreviation: HRP, high-risk plaque.
Abbreviations: CI, confidence interval; HRP, high-risk plaque.


Discussion
CAD is prevalent in both developing and developed countries, resulting in high morbidity and mortality. While advancements in care and treatment have reduced morbidity associated with acute coronary syndrome (ACS), the incidence continues to rise, especially among patients with comorbidities such as diabetes and hypertension. ACS primarily results from the erosion and rupture of vulnerable plaques, leading to thrombosis.[10] The development of CAD begins with intimal thickening and can progress to fibrocalcific plaques. Thin fibrous cap atheromas are particularly prone to rupture and are often responsible for acute events.[11]
Histologically, HRPs are characterized by a large lipid core, a thin fibrous cap, and signs of active inflammation, such as macrophage or T cell infiltration.[10] The CTCA features that indicate HRP include: (1) spotty calcification—small, punctate calcifications measuring 1 to 3 mm; (2) low attenuation plaque—a noncalcified plaque with attenuation below +30 HU; (3) positive remodeling—the outer diameter of the vessel at the plaque site divided by the average outer diameter of the proximal and distal vessel must be greater than 1.1; and (4) napkin-ring sign—a high attenuation rim surrounding a low attenuation core. A plaque is classified as high risk in CTCA if it shows two or more of these characteristics.[9]
The focus on identifying coronary lesions and recognizing vulnerable plaques at risk for rupture began in 2001.[12] [13] Schroeder et al suggested that CTCA, as a noninvasive method, could become a vital tool for risk stratification in patients with known or suspected CAD.[13] Research in the early 2000s indicated that plaque characterization could be achieved through CT based on HU values, demonstrating diagnostic accuracy comparable to intravascular ultrasound (IVUS).[14] [15] Obaid et al developed CT-derived plaque maps for characterizing coronary artery plaques.[15] HRP characteristics linked to ACS include positive vascular remodeling, low plaque density, and spotty calcification, as noted by Motoyama et al.[16] Otsuka et al found that the napkin-ring sign on CTCA is strongly correlated with future ACS events.[17] Saremi et al examined the histopathologic classification of coronary atherosclerotic plaques, concluding that CT can effectively identify patients at higher risk for coronary events by detecting HRP.[18]
Bittner et al determined that the definitions of HRP feature in CTCA enable better assessments of ACS patients compared with those based on IVUS.[19] van Veelen et al highlighted the difficulty of assessing plaque characterization through catheter CAG and advocated for the development of noninvasive imaging modalities to enhance screening and guide prevention or treatment for CAD by effectively identifying vulnerable plaques.[10] Dawson et al indicated that advancements in coronary imaging may facilitate a shift in cardiovascular care by allowing early identification and management of HRPs.[20] Heinsen et al pointed out that CTCA not only assesses coronary artery stenosis but also evaluates plaque morphology, which is an important prognostic indicator. Plaques that display both low attenuation and positive remodeling (HRP) have a strong association with future cardiovascular events, even in asymptomatic individuals.[21]
Wang et al categorized coronary plaques (n = 32) into four groups based on IVUS plaque material properties. Similarly, our study classified plaques based on attenuation (HU) values.[22] Lee et al noted that the rapid advancement of AI technologies may soon support clinical applications like automated coronary artery calcium scoring and plaque analysis.[23] van Assen et al emphasized that AI could significantly enhance CAD evaluation, playing a critical role in identifying, quantifying, and prognosticating CAD. Furthermore, AI could be pivotal in the identification and clinical application of novel imaging biomarkers and optimizing workflows for cardiac CT and coronary plaque analysis.[24] The advent of AI makes the identification of the lipid necrotic core within HRP increasingly significant.
Epicardial adipose tissue, including perivascular fat surrounding coronary arteries, plays a crucial role in cardiovascular health by secreting proinflammatory adipokines. This proinflammatory environment is a known contributor to the pathogenesis of CAD and ACS. Additionally, inflamed coronary vessels can release cytokines that modify the function and properties of adjacent perivascular fat.[25]
The perivascular fat attenuation index (FAI) has been validated as a noninvasive marker of coronary inflammation. It is derived from standardized CTA images to detect changes in perivascular fat around major coronary arteries, including the right coronary artery, left anterior descending artery, and left circumflex artery. A perivascular FAI above −70.1 HU is predictive of increased all-cause and cardiac-related mortality, even after adjusting for age, sex, and other risk factors. Elevated perivascular FAI is also linked with reduced global coronary flow reserve in patients with stable CAD and has been documented in cases of spontaneous coronary artery dissection and vasospastic angina. Consequently, perivascular FAI is a potentially valuable tool for identifying at-risk ACS patients who do not exhibit significant coronary artery stenosis.[26]
There is an unmet need for biomarkers that noninvasively visualize coronary inflammation and track responses to anti-inflammatory interventions in atherosclerosis. Perivascular adipose tissue (PVAT) acts as an in vivo biosensor of coronary inflammation by modifying its composition in response to inflammatory signals. The FAI detects coronary inflammation by quantifying dynamic spatial changes in PVAT attenuation.[25] [26] The PVAT fat attenuation value is significantly higher in the region of HRP compared with calcified or stable plaques. The PVAT fat attenuation ratio is calculated as PVAT fat attenuation at the site of lesion (lesion-specific PVAT) and at the normal site of vessel. The ratio arbitrary value of > 2 is considered significant in differentiating HRP from stable plaques (p < 0.05).
While invasive CAG is the gold standard for evaluating coronary plaques, it primarily assesses the percentage of luminal stenosis and cannot identify HRP features that predict rupture.[10] CTCA offers distinct advantages over internal carotid artery in plaque characterization and the identification of HRP.[10] It is now recognized as the preferred initial imaging modality for patients at risk of ACS due to its high negative predictive value.[27] The identification of a necrotic core within HRPs and changes in perivascular fat attenuation are expected to emerge as important imaging biomarkers for ACS in the near future.[26] [28] Perivascular fat attenuation provides incremental prognostic value beyond clinical characteristics and have potential role in the prediction of major adverse cardiovascular events.[29] [30]
One of the primary limitations of our study is the relatively small sample size, which may reduce the statistical power and limit the generalizability of our findings. Due to the restricted cohort, subgroup analysis—particularly for HRP features—was constrained. Additionally, this study was conducted at a single tertiary care center, which may introduce selection bias and reduce the external validity. Technical variability, including image acquisition parameters and differences in reconstruction algorithms, could also have influenced the interpretation of perivascular fat attenuation and plaque morphology. Lastly, the absence of long-term clinical follow-up limited our ability to correlate imaging biomarkers with cardiovascular outcomes. As a result, the findings should be interpreted with larger, multicenter studies, which would warrant to validate these preliminary observations.
Conclusion
This study is the first from India to evaluate coronary Perivascular Fat Attenuation Ratio (PVFAR), a promising non-invasive marker of coronary inflammation and high-risk plaques. Unlike invasive CAG, which is limited in characterizing plaque vulnerability, CTCA combined with FAI analysis offers valuable insight into plaque composition and inflammation. The ability of PVAT attenuation—especially through lesion-specific ratios—to differentiate HRPs from stable ones provides incremental prognostic value and may enhance risk stratification for ACS. As imaging technology evolves, PVAT-based metrics are poised to play a pivotal role in guiding personalized treatment strategies and predicting major adverse cardiovascular event. These parameters could serve as an additional diagnostic criterion for identifying HRP in CAD-RADS 3.0.
Conflict of Interest
None declared.
-
References
- 1 Ngam PI, Ong CC, Chai P, Wong SS, Liang CR, Teo LLS. Computed tomography coronary angiography - past, present and future. Singapore Med J 2020; 61 (03) 109-115
- 2 Miller JM, Rochitte CE, Dewey M. et al. Diagnostic performance of coronary angiography by 64-row CT. N Engl J Med 2008; 359 (22) 2324-2336
- 3 Meijboom WB, Meijs MF, Schuijf JD. et al. Diagnostic accuracy of 64-slice computed tomography coronary angiography: a prospective, multicenter, multivendor study. J Am Coll Cardiol 2008; 52 (25) 2135-2144
- 4 Kuchynka P, Lambert L, Černý V. et al. Coronary CT angiography. Cor Vasa 2015; 57: e425-e432
- 5 Morris PD, van de Vosse FN, Lawford PV, Hose DR, Gunn JP. “Virtual” (computed) fractional flow reserve: current challenges and limitations. JACC Cardiovasc Interv 2015; 8 (08) 1009-1017
- 6 Knuuti J, Wijns W, Saraste A. et al. 2019 ESC Guidelines for the diagnosis and management of chronic coronary syndromes. Eur Heart J 2020; 41 (03) 407-477
- 7 Kelion AD, Nicol ED. The rationale for the primacy of coronary CT angiography in the National Institute for Health and Care Excellence (NICE) guideline (CG95) for the investigation of chest pain of recent onset. J Cardiovasc Comput Tomogr 2018; 12 (06) 516-522
- 8 Gulati M, Levy PD, Mukherjee D. et al; Writing Committee Members. 2021 AHA/ACC/ASE/CHEST/SAEM/SCCT/SCMR guideline for the evaluation and diagnosis of chest pain: a report of the American College of Cardiology/American Heart Association Joint Committee on Clinical Practice Guidelines. J Cardiovasc Comput Tomogr 2022; 16 (01) 54-122
- 9 Cury RC, Leipsic J, Abbara S. et al. CAD-RADS™ 2.0 - 2022 Coronary Artery Disease - Reporting and Data System: an expert consensus document of the Society of Cardiovascular Computed Tomography (SCCT), the American College of Cardiology (ACC), the American College of Radiology (ACR) and the North America Society of Cardiovascular Imaging (NASCI). Radiol Cardiothorac Imaging 2022; 4 (05) e220183
- 10 van Veelen A, van der Sangen NMR, Delewi R, Beijk MAM, Henriques JPS, Claessen BEPM. Detection of vulnerable coronary plaques using invasive and non-invasive imaging modalities. J Clin Med 2022; 11 (05) 1361
- 11 Sandfort V, Lima JA, Bluemke DA. Noninvasive imaging of atherosclerotic plaque progression: status of coronary computed tomography angiography. Circ Cardiovasc Imaging 2015; 8 (07) e003316
- 12 Fayad ZA, Fuster V. Clinical imaging of the high-risk or vulnerable atherosclerotic plaque. Circ Res 2001; 89 (04) 305-316
- 13 Schroeder S, Kopp AF, Baumbach A. et al. Noninvasive detection and evaluation of atherosclerotic coronary plaques with multislice computed tomography. J Am Coll Cardiol 2001; 37 (05) 1430-1435
- 14 Leber AW, Knez A, Becker A. et al. Accuracy of multidetector spiral computed tomography in identifying and differentiating the composition of coronary atherosclerotic plaques: a comparative study with intracoronary ultrasound. J Am Coll Cardiol 2004; 43 (07) 1241-1247
- 15 Obaid DR, Calvert PA, Gopalan D. et al. Atherosclerotic plaque composition and classification identified by coronary computed tomography: assessment of computed tomography-generated plaque maps compared with virtual histology intravascular ultrasound and histology. Circ Cardiovasc Imaging 2013; 6 (05) 655-664
- 16 Motoyama S, Sarai M, Harigaya H. et al. Computed tomographic angiography characteristics of atherosclerotic plaques subsequently resulting in acute coronary syndrome. J Am Coll Cardiol 2009; 54 (01) 49-57
- 17 Otsuka K, Fukuda S, Tanaka A. et al. Napkin-ring sign on coronary CT angiography for the prediction of acute coronary syndrome. JACC Cardiovasc Imaging 2013; 6 (04) 448-457
- 18 Saremi F, Hassani C, Millan-Nunez V, Sánchez-Quintana D. Imaging evaluation of tricuspid valve: analysis of morphology and function with CT and MRI. AJR Am J Roentgenol 2015; 204 (05) W531-42
- 19 Bittner DO, Mayrhofer T, Puchner SB. et al. Coronary computed tomography angiography–specific definitions of high-risk plaque features improve detection of acute coronary syndrome: results from the ROMICAT II Trial. Circ Cardiovasc Imaging 2018; 11 (08) e007657
- 20 Dawson LP, Lum M, Nerleker N, Nicholls SJ, Layland J. Coronary atherosclerotic plaque regression: JACC state-of-the-art review. J Am Coll Cardiol 2022; 79 (01) 66-82
- 21 Heinsen LJ, Pararajasingam G, Andersen TR. et al. High-risk coronary artery plaque in asymptomatic patients with type 2 diabetes: clinical risk factors and coronary artery calcium score. Cardiovasc Diabetol 2021; 20 (01) 164
- 22 Wang L, Maehara A, Zhang X. et al. Quantification of patient-specific coronary material properties and their correlations with plaque morphological characteristics: an in vivo IVUS study. Int J Cardiol 2023; 371: 21-27
- 23 Lee H, Emrich T, Schoepf U. et al. Artificial intelligence in cardiac CT: automated calcium scoring and plaque analysis. Curr Cardiovasc Imaging Rep 2020; 13
- 24 van Assen M, von Knebel Doeberitz P, Quyyumi AA, De Cecco CN. Artificial intelligence for advanced analysis of coronary plaque. Eur Heart J Suppl 2023; 25 (Suppl C): C112-C117
- 25 Okamoto S, Mochizuki J, Matsumi H, Hashimoto K, Nikaido A, Hata Y. Perivascular fat attenuation index measured by coronary computed tomography angiography as a tool for assessment of ischaemia-causing lesions: a case report. BMC Cardiovasc Disord 2023; 23 (01) 140
- 26 Klüner LV, Oikonomou EK, Antoniades C. Assessing cardiovascular risk by using the fat attenuation index in coronary CT angiography. Radiol Cardiothorac Imaging 2021; 3 (01) e200563
- 27 Arbab-Zadeh A, Miller JM, Rochitte CE. et al. Diagnostic accuracy of computed tomography coronary angiography according to pre-test probability of coronary artery disease and severity of coronary arterial calcification. The CORE-64 (Coronary Artery Evaluation Using 64-Row Multidetector Computed Tomography Angiography) international multicenter study. J Am Coll Cardiol 2012; 59 (04) 379-387
- 28 Huang M, Han T, Nie X. et al. Clinical value of perivascular fat attenuation index and computed tomography derived fractional flow reserve in identification of culprit lesion of subsequent acute coronary syndrome. Front Cardiovasc Med 2023; 10: 1090397
- 29 Coerkamp CF, Verpalen VA, Kuipers RS. et al. Perivascular fat attenuation index (FAI) on computed tomography coronary angiography reclassifies individual cardiovascular risk estimation. Int J Cardiol Cardiovasc Risk Prev 2024; 24: 200360
- 30 Ding Y, Shan D, Han T. et al. Incremental prognostic value of perivascular fat attenuation index in patients with diabetes with coronary artery disease. Radiol Cardiothorac Imaging 2025; 7 (02) e240242
Address for correspondence
Publication History
Article published online:
11 February 2026
© 2026. Indian Radiological Association. This is an open access article published by Thieme under the terms of the Creative Commons Attribution-NonDerivative-NonCommercial License, permitting copying and reproduction so long as the original work is given appropriate credit. Contents may not be used for commercial purposes, or adapted, remixed, transformed or built upon. (https://creativecommons.org/licenses/by-nc-nd/4.0/)
Thieme Medical and Scientific Publishers Pvt. Ltd.
A-12, 2nd Floor, Sector 2, Noida-201301 UP, India
-
References
- 1 Ngam PI, Ong CC, Chai P, Wong SS, Liang CR, Teo LLS. Computed tomography coronary angiography - past, present and future. Singapore Med J 2020; 61 (03) 109-115
- 2 Miller JM, Rochitte CE, Dewey M. et al. Diagnostic performance of coronary angiography by 64-row CT. N Engl J Med 2008; 359 (22) 2324-2336
- 3 Meijboom WB, Meijs MF, Schuijf JD. et al. Diagnostic accuracy of 64-slice computed tomography coronary angiography: a prospective, multicenter, multivendor study. J Am Coll Cardiol 2008; 52 (25) 2135-2144
- 4 Kuchynka P, Lambert L, Černý V. et al. Coronary CT angiography. Cor Vasa 2015; 57: e425-e432
- 5 Morris PD, van de Vosse FN, Lawford PV, Hose DR, Gunn JP. “Virtual” (computed) fractional flow reserve: current challenges and limitations. JACC Cardiovasc Interv 2015; 8 (08) 1009-1017
- 6 Knuuti J, Wijns W, Saraste A. et al. 2019 ESC Guidelines for the diagnosis and management of chronic coronary syndromes. Eur Heart J 2020; 41 (03) 407-477
- 7 Kelion AD, Nicol ED. The rationale for the primacy of coronary CT angiography in the National Institute for Health and Care Excellence (NICE) guideline (CG95) for the investigation of chest pain of recent onset. J Cardiovasc Comput Tomogr 2018; 12 (06) 516-522
- 8 Gulati M, Levy PD, Mukherjee D. et al; Writing Committee Members. 2021 AHA/ACC/ASE/CHEST/SAEM/SCCT/SCMR guideline for the evaluation and diagnosis of chest pain: a report of the American College of Cardiology/American Heart Association Joint Committee on Clinical Practice Guidelines. J Cardiovasc Comput Tomogr 2022; 16 (01) 54-122
- 9 Cury RC, Leipsic J, Abbara S. et al. CAD-RADS™ 2.0 - 2022 Coronary Artery Disease - Reporting and Data System: an expert consensus document of the Society of Cardiovascular Computed Tomography (SCCT), the American College of Cardiology (ACC), the American College of Radiology (ACR) and the North America Society of Cardiovascular Imaging (NASCI). Radiol Cardiothorac Imaging 2022; 4 (05) e220183
- 10 van Veelen A, van der Sangen NMR, Delewi R, Beijk MAM, Henriques JPS, Claessen BEPM. Detection of vulnerable coronary plaques using invasive and non-invasive imaging modalities. J Clin Med 2022; 11 (05) 1361
- 11 Sandfort V, Lima JA, Bluemke DA. Noninvasive imaging of atherosclerotic plaque progression: status of coronary computed tomography angiography. Circ Cardiovasc Imaging 2015; 8 (07) e003316
- 12 Fayad ZA, Fuster V. Clinical imaging of the high-risk or vulnerable atherosclerotic plaque. Circ Res 2001; 89 (04) 305-316
- 13 Schroeder S, Kopp AF, Baumbach A. et al. Noninvasive detection and evaluation of atherosclerotic coronary plaques with multislice computed tomography. J Am Coll Cardiol 2001; 37 (05) 1430-1435
- 14 Leber AW, Knez A, Becker A. et al. Accuracy of multidetector spiral computed tomography in identifying and differentiating the composition of coronary atherosclerotic plaques: a comparative study with intracoronary ultrasound. J Am Coll Cardiol 2004; 43 (07) 1241-1247
- 15 Obaid DR, Calvert PA, Gopalan D. et al. Atherosclerotic plaque composition and classification identified by coronary computed tomography: assessment of computed tomography-generated plaque maps compared with virtual histology intravascular ultrasound and histology. Circ Cardiovasc Imaging 2013; 6 (05) 655-664
- 16 Motoyama S, Sarai M, Harigaya H. et al. Computed tomographic angiography characteristics of atherosclerotic plaques subsequently resulting in acute coronary syndrome. J Am Coll Cardiol 2009; 54 (01) 49-57
- 17 Otsuka K, Fukuda S, Tanaka A. et al. Napkin-ring sign on coronary CT angiography for the prediction of acute coronary syndrome. JACC Cardiovasc Imaging 2013; 6 (04) 448-457
- 18 Saremi F, Hassani C, Millan-Nunez V, Sánchez-Quintana D. Imaging evaluation of tricuspid valve: analysis of morphology and function with CT and MRI. AJR Am J Roentgenol 2015; 204 (05) W531-42
- 19 Bittner DO, Mayrhofer T, Puchner SB. et al. Coronary computed tomography angiography–specific definitions of high-risk plaque features improve detection of acute coronary syndrome: results from the ROMICAT II Trial. Circ Cardiovasc Imaging 2018; 11 (08) e007657
- 20 Dawson LP, Lum M, Nerleker N, Nicholls SJ, Layland J. Coronary atherosclerotic plaque regression: JACC state-of-the-art review. J Am Coll Cardiol 2022; 79 (01) 66-82
- 21 Heinsen LJ, Pararajasingam G, Andersen TR. et al. High-risk coronary artery plaque in asymptomatic patients with type 2 diabetes: clinical risk factors and coronary artery calcium score. Cardiovasc Diabetol 2021; 20 (01) 164
- 22 Wang L, Maehara A, Zhang X. et al. Quantification of patient-specific coronary material properties and their correlations with plaque morphological characteristics: an in vivo IVUS study. Int J Cardiol 2023; 371: 21-27
- 23 Lee H, Emrich T, Schoepf U. et al. Artificial intelligence in cardiac CT: automated calcium scoring and plaque analysis. Curr Cardiovasc Imaging Rep 2020; 13
- 24 van Assen M, von Knebel Doeberitz P, Quyyumi AA, De Cecco CN. Artificial intelligence for advanced analysis of coronary plaque. Eur Heart J Suppl 2023; 25 (Suppl C): C112-C117
- 25 Okamoto S, Mochizuki J, Matsumi H, Hashimoto K, Nikaido A, Hata Y. Perivascular fat attenuation index measured by coronary computed tomography angiography as a tool for assessment of ischaemia-causing lesions: a case report. BMC Cardiovasc Disord 2023; 23 (01) 140
- 26 Klüner LV, Oikonomou EK, Antoniades C. Assessing cardiovascular risk by using the fat attenuation index in coronary CT angiography. Radiol Cardiothorac Imaging 2021; 3 (01) e200563
- 27 Arbab-Zadeh A, Miller JM, Rochitte CE. et al. Diagnostic accuracy of computed tomography coronary angiography according to pre-test probability of coronary artery disease and severity of coronary arterial calcification. The CORE-64 (Coronary Artery Evaluation Using 64-Row Multidetector Computed Tomography Angiography) international multicenter study. J Am Coll Cardiol 2012; 59 (04) 379-387
- 28 Huang M, Han T, Nie X. et al. Clinical value of perivascular fat attenuation index and computed tomography derived fractional flow reserve in identification of culprit lesion of subsequent acute coronary syndrome. Front Cardiovasc Med 2023; 10: 1090397
- 29 Coerkamp CF, Verpalen VA, Kuipers RS. et al. Perivascular fat attenuation index (FAI) on computed tomography coronary angiography reclassifies individual cardiovascular risk estimation. Int J Cardiol Cardiovasc Risk Prev 2024; 24: 200360
- 30 Ding Y, Shan D, Han T. et al. Incremental prognostic value of perivascular fat attenuation index in patients with diabetes with coronary artery disease. Radiol Cardiothorac Imaging 2025; 7 (02) e240242