

Subscribe to RSS
DOI: 10.1055/s-0045-1812492
Differentiation of Triple-Negative Phenotypes of Breast Cancer from Others Using Multiparametric Magnetic Resonance Imaging: A Prospective Imaging Study
Authors
Funding None.


Abstract
Objective
To predict and differentiate triple-negative (TNBC) from non-triple-negative breast cancer (NTNBC) phenotypes using multiparametric magnetic resonance imaging (MpMRI).
Materials and Methods
One hundred and two patients with BI-RADS 5/6 lesions who underwent MpMRI (3 Tesla) and were diagnosed with invasive ductal carcinoma on histopathological analysis after ultrasound-guided biopsy were categorized into TNBC and NTNBC groups based on immunohistochemistry. MRI included T1-weighted imaging, T2-weighted imaging, dynamic contrast-enhanced MRI (DCE-MRI), diffusion-weighted imaging, and magnetic resonance spectroscopy (MRS). Morphological, semiquantitative, and quantitative DCE parameters, apparent diffusion coefficient (ADC) values, and MRS (tCho) were studied. Nonparametric categorical variables were analyzed using the chi-square test, continuous nonparametric variables using the Kruskal–Wallis, and continuous parametric variables using the ANOVA test to determine the association of parameters with NTNBC/TNBC subtypes. Receiver operating characteristic and logistic regression analyses were done to determine the diagnostic performance and independent predictors.
Results
Seventy-two cases were NTNBCs, and 30 cases were TNBCs. TNBCs showed more circumscribed margins (51.7%), rim enhancement (65.5%), perilesional edema (80%), unifocal lesions (76.7%), and axillary lymphadenopathy (73.3%). NTNBCs showed more irregular shapes (81.8%) and spiculated margins (56.1%). Choline peaks on MRS were more frequent in TNBC (60%). TNBCs had higher mean Ktrans (>0.53 min−1), higher signal enhancement ratio (>72.95), lower mean Ve (<0.34), and lower ADC values (<0.83 × 10⁻³ mm2/s). Multivariate regression analysis identified rim enhancement (odds ratio [OR]: 25.11), high mean Ktrans (OR: 17.25), and low Ve (OR: 0.004 for high Ve) as independent predictors of the TNBC subtype.
Conclusion
MpMRI parameters could differentiate TNBC from NTNBC, offering potential noninvasive biomarkers, enhancing diagnostic precision, indicating revision of histopathological evaluation reports in doubtful cases, prognostication, and personalized patient management.
Keywords
triple-negative breast cancer - multiparametric MRI - diffusion-weighted imaging - DCE-MRI - magnetic resonance spectroscopyIntroduction
Breast cancer is the most common malignancy in women worldwide, accounting for 25% of all female cancers and the leading cause of cancer-related death among women. In 2022, the World Health Organization reported 2.3 million new cases and 670,000 deaths globally.[1]
Breast cancer subtypes differ in incidence, prognosis, treatment response, survival, and recurrence, requiring personalized treatment strategies. Even patients with similar histopathological features and cancer stages may show varied clinical outcomes, emphasizing the need for subtype-specific management.[2] [3] [4] Triple-negative breast cancer (TNBC), comprising approximately 15% of all breast cancers, is among the most aggressive forms, characterized by the absence of estrogen, progesterone, and HER2 receptors. It is associated with poor prognosis, high invasiveness, higher metastatic potential, limited treatment options, a high relapse rate, short progression-free survival, and lower overall survival than the non-TNBC (NTNBC) group.[5] Magnetic resonance imaging (MRI) is a sensitive, noninvasive imaging tool increasingly used to assess breast cancer. Imaging features are being studied as biomarkers for diagnosis, prognosis, and subtype prediction. Multiparametric MRI (MpMRI) could aid in noninvasive subtype prediction, improving clinical decisions and enabling targeted therapy.[6] [7] [8] Up to 20% of estrogen receptor (ER) and progesterone receptor (PR) immunohistochemical results may be inaccurate due to pre-analytic factors, threshold values, and evaluation criterion variations.[5] [9] MRI features suggestive of TNBC may warrant reassessment of pathology results, potentially altering patient management.
Diffusion-weighted imaging (DWI) evaluates water molecule diffusion, which is restricted in malignant tissues, resulting in lower apparent diffusion coefficient (ADC) values. The ACR BI-RADS lexicon describes morphological features (tumor size, margins, internal enhancement, background parenchymal enhancement [BPE]), while quantitative biomarkers like dynamic contrast-enhanced MRI (DCE-MRI) assess tumor perfusion and capillary permeability due to neoangiogenesis.[8] [10] Magnetic resonance spectroscopy (MRS), particularly choline detection, adds value to breast cancer diagnosis.[11] We hypothesize that combining conventional imaging with advanced MRI sequences like DCE-MRI, generating quantitative/semiquantitative parameters, DWI, and MRS, can create accurate models to distinguish the more aggressive TNBC variety from the NTNBC subtypes. To our knowledge, this is one of the few prospective, comprehensive studies evaluating morphologic, DWI, DCE-MRI, and MRS parameters for differentiation of TNBC from the NTNBCs, especially in Indian women.
Materials and Methods
A single-center prospective hospital-based observational study was conducted from March 2023 to December 2024 in the Department of Radiodiagnosis of a tertiary care hospital after obtaining clearance from the Institutional Ethics Committee. Patients with BI-RADS 5/6 lesions who were referred for breast MRI predominantly for pretreatment staging as a part of the institutional protocol to assess exact tumor size, multifocality, multicentricity, and chest wall/skin involvement, or to detect occult lesions, especially in the dense breasts, were enrolled in the study. Newly diagnosed cases were imaged at least after 2 weeks of biopsy to minimize interference from post-biopsy hemorrhage and edema. Patients on post-neoadjuvant chemotherapy follow-up or with suspected recurrence were excluded. After obtaining consent, the included patients underwent MRI of bilateral breasts in a 3-Tesla MRI scanner (Discovery 750W, GE Healthcare) using a 16-channel breast coil with the patient positioned in the prone position. BI-RADS 5 lesions underwent USG (ultrasound)-guided tru-cut biopsy using a 14G core needle automatic biopsy gun, followed by a histopathological study with immunohistochemistry (IHC) to determine hormone receptors (ER and PR) and HER2 overexpression. The histopathological evaluation and IHC reports containing the receptor status were collected. The MRI protocol followed is depicted in [Table 1].
Abbreviations: DCE-MRI, dynamic contrast-enhanced MRI; DWI, diffusion-weighted imaging; FOV, field of view; MRI, magnetic resonance imaging; NEX, number of excitations; TE, echo time; TR, repetition time.
Image Analysis
The image analysis and interpretation of all the scans were made in AW Server 3.2 Extension 2.0 (GE Healthcare) multipurpose workstation by two radiologists with more than 6 years of experience interpreting breast MRIs. There was an excellent interobserver agreement, with a weighted Kappa value of 0.91 (confidence interval: 95%, standard error: 0.03).
Conventional sequences like T1-weighted imaging (T1WI) and T2-weighted imaging (T2WI) were used to visually assess the lesion and perilesional characteristics. The qualitative imaging parameters included the amount of fibroglandular tissue (FGT) (ACR types A, B, C, or D), BPE level (minimal, mild, moderate, marked), symmetry (symmetric or asymmetric), perilesional edema (present or absent), multifocality (present or absent), and associated axillary lymphadenopathy (present or absent). Morphological parameters like shape (round/oval or irregular), margin (circumscribed, irregular, or spiculated), and enhancement type (homogeneous, heterogeneous, and rim-type) were analyzed using post-contrast T1WI and T2WI sequences as required. Perilesional edema, linked to tumor aggressiveness, which may result from increased vascular permeability, inflammatory response, or tumor-induced lymphatic obstruction, was defined as high signal intensity on T2-weighted fat-suppressed images without showing enhancement in post-contrast subtraction images, indicating fluid retention.
DCE-MRI post-processing and analysis of quantitative parameters (Ktrans, Kep, and Ve) were done using external MATLAB software. The data obtained were assessed with parametric maps using the Tofts model. The first region of interest (ROI) with an area range of 10 to 20 mm2 was placed in the descending aorta to determine the arterial input function. The second ROI was placed within the lesion, excluding the necrotic/hemorrhagic areas, vessels, and adjacent normal breast parenchyma. Time–intensity curves were generated in several corresponding pixels within the selected ROI. Functional maps of these parameters were generated and displayed in various colors.
Semiquantitative parameters, signal intensity ratio (SER), maximum slope of increase (MSI), and positive enhancement integral (PEI) were calculated by placing an elliptical ROI of area ranging from 4 to 20 mm2 over the lesion showing maximum contrast opacification represented by the maximally perfused region on the color-coded computer-aided detection (CAD) image.
Since all the lesions in our study showed diffusion restriction with hyperintensity on DWI and hypointensity on corresponding ADC maps, only quantitative mean ADC values obtained at different b-values (b = 0 and b = 1,000) were analyzed. Three similar-sized elliptical ROIs (range of ROI is 4–20 mm2) were drawn in areas of maximum restriction, excluding necrotic, hemorrhagic, and calcified regions, and the mean of these ROIs was considered.
The localized single-voxel MR spectra were acquired using the point-resolved spectroscopic sequence (PRESS). The spectroscopic voxel was placed within the lesion, excluding normal breast parenchyma on the post-contrast image. The spectroscopic data were processed to identify peaks corresponding to different metabolites, namely, the total choline (tCho) peak at 3.2 ppm and the lipid peak at 1.3 ppm, and the tCho resonance was qualitatively analyzed. Another similar voxel was placed in the normal breast tissue of the contralateral breast to compare metabolites.
The patient selection and detailed methodology are depicted as a flowchart ([Fig. 1]).

Data Collection and Statistical Analysis
SPSS software version 26.0 (IBM SPSS Statistics, Somers, New York, United States) was employed to analyze data entered into a Microsoft Excel datasheet. Categorical data were expressed as percentages, and quantitative data as mean ± standard deviation. Parametric variables were analyzed using ANOVA (analysis of variance), while nonparametric categorical and continuous variables were assessed using the chi-square and Kruskal–Wallis tests, respectively. A p-value <0.05 was considered significant. Receiver operating characteristic (ROC) curve analysis was used to determine cut-off values and diagnostic performance (sensitivity, specificity, and positive and negative predictive values). Binary logistic regression identified predictors of the TNBC subtype of invasive ductal carcinoma (IDC).
Results
Our study included 102 patients with IDC, of which 17 (16.7%) had luminal A subtype, 31 (31.4%) had luminal B subtype, 24 (22.5%) had HER2+ subtype, and 30 (29.4%) had TNBC subtype of IDC. The cases were divided into the TNBC group (n = 30; [Fig. 2]) and the NTNBC group (n = 72; [Fig. 3]), which includes luminal A, luminal B, and HER2+ subtypes.


Morphological Imaging Parameters
The average age of the patients in our study was 47 years, ranging from 20 to 76 years. The mean age was 51 years in the TNBC group and 48 years in the NTNBC group. The mean size was 3.20 ± 1.12 cm in the TNBC category, 2.98 ± 1.54 cm in the NTNBC. No significant correlation existed between the two groups' mean age or mean lesion size.
Of the 102 cases, 62 showed type A/B FGT, whereas 40 showed type C/D FGT. Minimal or mild BPE was observed in 18 lesions (60%) of the TNBC subtype group and 40 lesions (55.6%) of the NTNBC subtype group. Moderate or marked BPE was present in 12 lesions (40%) of the TNBC subtype group and 32 (44.4%) lesions of the NTNBC group. BPE was symmetrical in 63 cases and asymmetrical in 39. No significant correlation existed between the amount of FGT and BPE level and symmetry between the TNBC and NTNBC subgroups.
Out of 102 lesions, 95 were masses, and 7 were non-mass enhancements. Shape, margin, and enhancement type were analyzed only for the mass lesions ([Table 1]).
Shape of the Lesion
Of all the cases with mass lesions (n = 95), 25 were oval/round, and 70 were irregular. Among the TNBC subtype group, 13 (44.8%) lesions were round/oval, and 16(55.2%) lesions were irregular in shape; in the NTNBC subgroup, 12 (18.2%) lesions were round/oval, and 54 (81.8%) lesions were irregular. There is a significant correlation between the irregular shape of the lesion and NTNBC subtypes (p = 0.008).
Margin of the Lesion
Among the TNBC subtype group, 15 (51.7%) lesions showed circumscribed margins, 9 (31%) lesions showed irregular margins, and 5 (17.3%) lesions showed spiculated margins; in the NTNBC subtype group, 9 (13.6%) lesions showed circumscribed margins, 20 (30.3%) lesions showed irregular margins, and 37 (56.1%) lesions showed spiculated margins. A significant correlation was found between lesion margins and molecular subgroups, with NTNBC subtypes predominantly exhibiting spiculated margins (56.1%; p < 0.001).
Type of enhancement of the Lesion
In the TNBC group, 10 lesions (34.5%) exhibited heterogeneous enhancement, while 19 (65.5%) demonstrated rim enhancement. In contrast, within the NTNBC group, heterogeneous enhancement was observed in 55 lesions (83.3%), and rim enhancement in 11 lesions (16.7%). This difference was statistically significant (p < 0.001), with rim enhancement predominantly associated with TNBC and heterogeneous enhancement more common in NTNBC.
Multifocality
In our study, multifocality was observed in 42 lesions, with 35 belonging to the NTNBC group and 7 to the TNBC group. This distribution showed a statistically significant association (p = 0.015), indicating that multifocal lesions were significantly more prevalent in the NTNBC subgroup than TNBC.
Perilesional Edema
Within the TNBC subtype group, perilesional edema was present in 24 (80%) lesions and absent in 6 (20%) lesions; in the NTNBC subgroup, perilesional edema was present in 32 (44.4%) lesions and absent in 40 (55.6%) lesions. Perilesional edema was significantly associated with TNBC subgroups compared with NTNBC subgroups (p = 0.001).
Axillary Lymphadenopathy
Within the TNBC subtype group, axillary lymphadenopathy was present in 22 (73.3%) lesions and absent in 8 (26.7%) lesions; in the NTNBC subgroup, it was present in 37 (51.4%) lesions and absent in 35 (48.6%) lesions. A significant correlation was found between axillary lymphadenopathy and the molecular subgroup, with axillary lymphadenopathy more commonly associated with the TNBC group than the NTNBC group (p = 0.03).
Magnetic Resonance Spectroscopy
In the TNBC subtype group, choline peak was present in 18 (60%) lesions and absent in 12 (40%) lesions; in the NTNBC subgroup, choline peak was present in 23 (31.9%) lesions and absent in 49 (68.1%) lesions. A prominent choline peak was more commonly associated with TNBC subtype than NTNBC subtypes (p = 0.008; [Table 2]).
Abbreviations: BPE, background parenchymal enhancement; FGT, fibroglandular tissue; MRS, magnetic resonance spectroscopy; NTNBC, non-triple-negative breast cancer; TNBC, triple-negative breast cancer.
DCE Kinetic Semiquantitative and Quantitative Parameters
On analyses, the p-values of Ktrans, Ve, and SER were less than 0.05, indicating a statistically significant difference in their means between the TNBC and NTNBC molecular subgroups ([Table 3]). TNBC subtypes were more commonly associated with higher Ktrans and SER values and lower Ve values than NTNBC subtypes.
Abbreviations: ADC, apparent diffusion coefficient; DCE-MRI, dynamic contrast-enhanced MRI; MSI, maximum slope of increase; NTNBC, non-triple-negative breast cancer; PEI, positive enhancement integral; SD, standard deviation; SER, signal intensity ratio; TNBC, triple-negative breast cancer.
There was no significant difference in the mean values of MSI, PEI, and Kep among the molecular subgroups, as the p-value was greater than 0.05 (p = 0.15 for MSI, p = 0.70 for PEI, and p = 0.38 for Kep).
Diffusion-Weighted Imaging and ADC Map
All the cases in our study demonstrated diffusion restriction on DWI (hyperintense on DWI and hypointense on the corresponding ADC map). The ADC values of the lesions were compared across the groups. The mean ADC value for the TNBC group cases was 0.83 ± 0.16 × 10⁻³ mm2/s, and for NTNBC was 0.91 ± 0.16 × 10⁻³ mm2/s. Statistical analysis revealed significant differences in mean ADC values between TNBC and NTNBC subgroups (p = 0.035), indicating that TNBC subtypes generally have lower ADC values than NTNBC subtypes ([Table 3]).
Regression Analysis
Variables with a statistically significant association with TNBC (p < 0.05) were included in the regression analysis, while those with p >0.05 were excluded.
The univariate analysis revealed that several imaging and functional parameters were significantly associated with TNBC, including perilesional edema, unifocal presentation, circumscribed margins, rim enhancement, axillary lymphadenopathy, Ve, SER, ADC, Ktrans, and the presence of a choline peak on MRS.
These significant predictors were then entered into a multivariate logistic regression model to assess their independent predictive value. After adjusting for potential confounders, only three parameters emerged as independent predictors of the TNBC subtype: Rim enhancement (odds ratio [OR]: 25.11), low Ve (OR: 0.004 for high Ve), and high Ktrans (OR: 17.25; [Table 4]).
Abbreviations: ADC, apparent diffusion coefficient; CI, confidence interval; MRS, magnetic resonance spectroscopy; NA, not applicable; OR, odds ratio; SER, signal intensity ratio; TNBC, triple-negative breast cancer.
ROC Curve Analysis for Diagnostic Performance of Various Parameters in Predicting TNBC Subtype
The diagnostic performance of various imaging parameters in predicting the TNBC subtype of breast cancer ([Fig. 4]) shows that DCE, DWI, and MRS (combined approach) have the highest area under the curve (AUC; 0.93). Morphological parameters had a high AUC (0.89) and reasonable specificity (87.5%). The semiquantitative parameter (SER) demonstrated excellent sensitivity (90%) and high negative predictive value (NPV; 92.9%). Quantitative parameters (Ktrans and Ve) offer high specificity (90.3%) but low sensitivity (46%; [Table 5]).
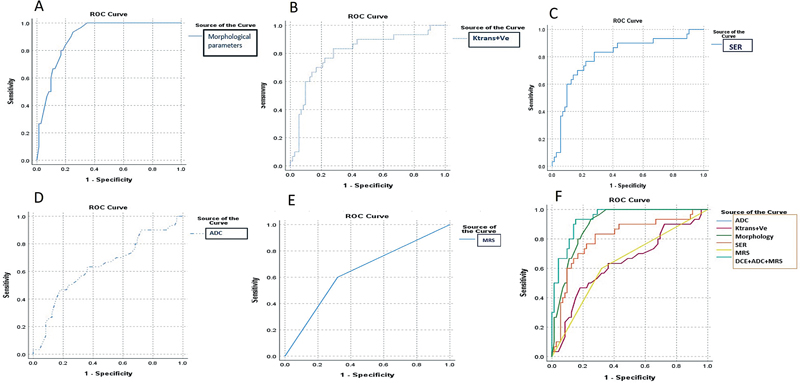
Abbreviations: AUC, area under the curve; DCE, dynamic contrast enhanced; DWI, diffusion-weighted imaging; MRS, magnetic resonance spectroscopy; NPV, negative predictive value; PPV, positive predictive value.
Discussion
Our prospective observational study included 102 patients with IDC, of which 17 (16.7%) had luminal A subtype, 31 (31.4%) had luminal B subtype, 24 (22.5%) had HER2+ subtype, and 30 (29.4%) had TNBC subtype of IDC. A similar distribution of molecular subtypes was reported in a study by Yang et al.[12]
Studies conducted by Chen et al (studied 116 patients) and Gigli et al (included 75 patients) reported mean patient ages of 51.9 years (range: 26–74 years) and 58 years (range: 32–76 years), respectively.[13] [14] These studies found no significant correlation between molecular subtypes and mean patient age. Our findings were consistent with their study results, with a mean age of 51.7 years (range: 23–76 years). However, a study by Costantini et al demonstrated that TNBC is predominantly associated with younger age groups.[6]
In our study, the HER2+ subtype group had the largest mean lesion size (3.2 ± 1.2 cm) compared with other groups (luminal A: 2.3 cm, luminal B: 2.6 cm, TNBC: 3.2 cm), although this difference was not statistically significant. Similarly, Szep et al reported the largest tumor size for the HER2+ subtype, with a mean size of 3.72 cm, achieving statistical significance.[15] In contrast, studies by Chen et al and Elmaghraby et al found no correlation between molecular subtypes and tumor size.[13] [16]
Most patients in our study exhibited type B breast density and symmetrical moderate BPE, which showed no significant association with molecular subtypes. However, a study by Dilorenzo et al found that marked BPE is significantly associated with the TNBC subtype, as opposed to the findings by You et al, who reported that TNBC is associated with mild BPE.[17] [18]
In our study, TNBC predominantly exhibited circumscribed margins (51.7%), rim enhancement (65.5%), unifocal presentation (76.7%), and perilesional edema (80%). These findings align with studies by Chen et al and Galati et al, which similarly reported these imaging characteristics in TNBC.[13] [19] They also concluded that rim enhancement is independently associated with the TNBC subtype, similar to our regression analysis findings.
A recent study conducted by Elmaghraby et al in 2024, involving 135 patients, corroborated these findings for TNBC subtypes, reporting oval shape (78%), circumscribed margins (78%), rim enhancement (61%), and unifocal lesions (100%).[16]
However, unlike our study, which found a significant association between TNBC and perilesional edema, the study by Elmaghraby et al did not observe this association.
Our study found a significant correlation between axillary lymphadenopathy and the TNBC subgroup, unlike those of Elmaghraby et al and Ren et al, who reported no correlation between axillary lymphadenopathy and molecular subtypes.[16] [20]
TNBC typically exhibits the lowest ADC values among various subtypes due to its high cellularity and dense stroma, which restricts water diffusion. HER2 + -positive tumors also show relatively low ADC values, reflecting their aggressive nature. In contrast, luminal subtypes (A and B) demonstrate higher ADC values due to lower cellularity and less restricted diffusion. These findings are consistent with the study by Zhao et al, which reported that the TNBC subtype had the lowest mean ADC value compared with the NTNBC subtypes. Yang et al also stated similar results, with TNBC having the lowest mean ADC values (0.78 × 10⁻³ mm2/s).[12] [21]
However, some studies, including those by Youk et al and Moffa et al, have shown lower ADC values in luminal subtypes (0.89 × 10⁻³ mm2/s) compared with nonluminal subtypes (1.03 × 10⁻³ mm2/s in TNBC and 0.84 × 10⁻³ mm2/s in HER2+ subtype).[22] [23] This discrepancy is attributed to TNBC and HER2+ subtypes being more frequently associated with intratumoral necrosis, which can result in higher ADC values and differences in the placement of the ROI within the lesion. Furthermore, a meta-analysis conducted in 2021 and a study by Szep et al concluded that no significant correlation exists between ADC values and molecular subtypes.[15]
We have evaluated three quantitative and three semiquantitative parameters of DCE-MRI. Three of the six parameters evaluated (Ktrans, Ve, and SER) showed statistically significant variations between TNBC and NTNBC subtypes. However, Kep, MSI, and PEI did not demonstrate significant differences.
In our study, SER values are significantly higher in the TNBC subtype than in the others. These results are similar to those of Gigli et al and Heacock et al, who stated that SER values are significantly higher in TNBC subtypes than in the other molecular subtypes.[14] [24] Similar to a study by Gelezhe et al, our study also did not show a significant difference in the mean values of PEI in various molecular subtypes.[25]
Of the three quantitative parameters studied, Ktrans and Ve were statistically significant in differentiating TNBC from NTNBC, with the TNBC subtype showing higher Ktrans and lower Ve values than the NTNBC subgroup. However, Kep values did not correlate significantly between the TNBC and NTNBC subgroups. These findings align with Li et al's study, which concluded that Ve is significantly lower in the TNBC subtype than the NTNBC subtype.[26] Our findings differ from those of Liu et al, who reported that the TNBC subtype is significantly associated with higher Ve than the NTNBC subtypes.[27] A study by Yang et al reported that Kep values in the TNBC (0.90 ± 0.22) subtype are higher than those in the NTNBC subtypes, and a cut-off of 0.89 yielded a sensitivity of 55%, a specificity of 76%, and an AUC of 0.89.[12] However, Kep did not significantly correlate with molecular subtypes in our study.
There have not been many studies on MRS using the tCho peak detection as a criterion to distinguish between various molecular subtypes. A significant difference in the occurrence of a tCho peak was found in our study; around 60% of the TNBC subtype displayed a choline peak, whereas only 31.9% of the NTNBC subtype showed a tCho peak. This was similar to the studies by Montemezzi et al, who stated that TNBC subtypes are significantly associated with tCho peaks.[28] However, authors like Galati et al and Sah et al, in their studies, mentioned that the tCho peak is less commonly seen in TNBC than in other subtypes due to central necrosis of the lesion.[19] [29] TNBCs demonstrated tCho more frequently, probably due to their more aggressive nature and higher tumor grades.
We found that the combined use of DCE-MRI, DWI, and MRS has the highest accuracy (84.3%) and higher specificity (91.7%). A combined algorithm using DCE-MRI, DWI, and MRS could predict TNBC with a specificity of 86.6% and a sensitivity of 100% in a study by Sharma et al with 50 patients.[30]
In our study, morphological parameters demonstrated strong diagnostic potential, yielding a high AUC of 0.89 and a specificity of 87.5%. Semiquantitative DCE-MRI parameters exhibited excellent sensitivity (90%) and a high NPV, making them effective for identifying TNBC cases. In contrast, quantitative DCE-MRI parameters, such as Ktrans and Ve, provided high specificity (90.3%) but lower sensitivity (46%), suggesting they are more reliable for excluding non-TNBC subtypes.
The univariate and multivariate logistic regression showed that while multiple imaging features are individually associated with TNBC, rim enhancement, elevated Ktrans, and reduced Ve are the most robust and independent imaging biomarkers for predicting this aggressive breast cancer subtype.
The strengths of our study are its prospective nature, relatively larger number of study patients as compared with previous similar studies, use of a 3T MRI compared with the 1.5T MRI used in most previous studies, determination of quantitative DCE parameters using external software, and incorporation of MRS for the characterization of breast cancer molecular subtypes has been used in only a limited number of prior studies, highlighting the novelty of our approach. The small sample size and single-center design limit the generalizability of our findings to the broader population. Our study categorized patients based on core biopsy IHC as this is the practical basis for initial treatment decisions. The discordance between core biopsy and surgical specimen IHC is well-documented; we did not re-verify with surgical specimens, which may influence the accuracy of subtype classification. While clinical practice requires recognition of all intrinsic subtypes, we chose TNBC versus NTNBC categorization to directly answer whether MpMRI can reliably flag TNBC, which is aggressive and lacks targeted therapies.
We conclude that MpMRI can reliably differentiate and predict TNBC subtypes of breast cancer. Morphological imaging features such as tumor shape, margin, enhancement patterns, multifocality, perilesional edema, and ADC values derived from DWI effectively identify TNBCs. Functional MRI parameters, including semiquantitative and quantitative metrics like Ktrans, Kep, Ve, SER, and MSI, can predict TNBCs. Statistically significant MRS findings further support their role in TNBC identification. This can help develop noninvasive biomarkers and revise histopathological evaluation reports in doubtful cases, as well as prognostication and personalized patient management.
Conflict of Interest
None declared.
Acknowledgments
The authors would like to acknowledge Late Prof. Dr. Nerbadyswari Deep Bag, the then HOD of the Department of Radiodiagnosis, AIIMS Bhubaneswar, Mr. Himanshu Shekhar, Mr. Subodh Bisht, Mr. Guru Prasad Semwal, Mrs. Sumitra Patra, and Mr. Nirmal Panda, Radiographers, Department of Radiodiagnosis, AIIMS Bhubaneswar, for dedicating their time in carrying out the MRI scans.
Authors' Contributions
S.M.: conceptualization, methodology, supervision, writing—original draft preparation, editing, reviewing, diagnosis, follow-up imaging, and biopsy of the lesions.
P.S: data curation, writing—original draft preparation, editing, and reviewing.
D.K.M.: supervision, methodology, reviewing, and patient treatment.
P.K.: supervision, methodology, reviewing, and patient treatment.
S.K.D.M.: supervision, methodology, reviewing, and patient treatment.
P.M.: supervision, methodology, editing, and reviewing.
S.B.: helped with software for analysis of DCE-MRI data and calculation of quantitative parameters of all the patients, and reviewing.
S.N.: supervision, methodology, and reviewing.
T.T.: supervision, methodology, and reviewing.
R.K.P.: supervision, methodology, editing, and reviewing.
A.P.: supervision, methodology, and reviewing.
P.K.S.: Supervision, methodology, reviewing, and patient treatment.
-
References
- 1 Sung H, Ferlay J, Siegel RL. et al. Global Cancer Statistics 2020: GLOBOCAN estimates of incidence and mortality worldwide for 36 cancers in 185 countries. CA Cancer J Clin 2021; 71 (03) 209-249
- 2 Polyak K. Heterogeneity in breast cancer. J Clin Invest 2011; 121 (10) 3786-3788
- 3 Goldhirsch A, Wood WC, Coates AS, Gelber RD, Thürlimann B, Senn HJ. Panel members. Strategies for subtypes–dealing with the diversity of breast cancer: highlights of the St. Gallen International Expert Consensus on the Primary Therapy of Early Breast Cancer 2011. Ann Oncol 2011; 22 (08) 1736-1747
- 4 Yersal O, Barutca S. Biological subtypes of breast cancer: prognostic and therapeutic implications. World J Clin Oncol 2014; 5 (03) 412-424
- 5 Yetkin Dİ, Akpınar MG, Durhan G, Demirkazik FB. Comparison of clinical and magnetic resonance imaging findings of triple-negative breast cancer with non-triple-negative tumours. Pol J Radiol 2021; 86: e269-e276
- 6 Costantini M, Belli P, Distefano D. et al. Magnetic resonance imaging features in triple-negative breast cancer: comparison with luminal and HER2-overexpressing tumors. Clin Breast Cancer 2012; 12 (05) 331-339
- 7 Li W, Yu K, Feng C, Zhao D. Molecular subtypes recognition of breast cancer in dynamic contrast-enhanced breast magnetic resonance imaging phenotypes from radiomics data. Comput Math Methods Med 2019; 2019: 6978650
- 8 Muthuvel D, Mohakud S, Deep N. et al. Usefulness of combined advanced dynamic contrast-enhanced and diffusion-weighted MRI over ultrasonography in differentiating cancer from benign lesions in dense breasts. Cureus 2024; 16 (09) e69634
- 9 Hammond ME, Hayes DF, Dowsett M. et al. American Society of Clinical Oncology/College of American Pathologists guideline recommendations for immunohistochemical testing of estrogen and progesterone receptors in breast cancer. J Clin Oncol 2010; 28 (16) 2784-2795
- 10 Galati F, Rizzo V, Trimboli RM, Kripa E, Maroncelli R, Pediconi F. MRI as a biomarker for breast cancer diagnosis and prognosis. BJR Open 2022; 4 (01) 20220002
- 11 Sharma U, Agarwal K, Hari S. et al. Role of diffusion weighted imaging and magnetic resonance spectroscopy in breast cancer patients with indeterminate dynamic contrast enhanced magnetic resonance imaging findings. Magn Reson Imaging 2019; 61: 66-72
- 12 Yang Z, Chen X, Zhang T. et al. Quantitative multiparametric MRI as an imaging biomarker for the prediction of breast cancer receptor status and molecular subtypes. Front Oncol 2021; 11: 628824
- 13 Chen H, Li W, Wan C, Zhang J. Correlation of dynamic contrast-enhanced MRI and diffusion-weighted MR imaging with prognostic factors and subtypes of breast cancers. Front Oncol 2022; 12: 942943
- 14 Gigli S, Amabile MI, David E. et al. Morphological and semiquantitative kinetic analysis on dynamic contrast enhanced MRI in triple negative breast cancer patients. Acad Radiol 2019; 26 (05) 620-625
- 15 Szep M, Pintican R, Boca B. et al. Multiparametric MRI features of breast cancer molecular subtypes. Medicina (Kaunas) 2022; 58 (12) 1716
- 16 Elmaghraby A, Soliman B, Zaiton F, Nawar N, Altaher K. Correlation between multiparametric magnetic resonance imaging (MRI) descriptors and breast cancer molecular subtypes. Zagazig Univ Med J 2024; 30 (1.2): 389-400
- 17 Dilorenzo G, Telegrafo M, La Forgia D, Stabile Ianora AA, Moschetta M. Breast MRI background parenchymal enhancement as an imaging bridge to molecular cancer sub-type. Eur J Radiol 2019; 113: 148-152
- 18 You C, Zhang Y, Chen Y. et al. Evaluation of background parenchymal enhancement and histogram-based diffusion-weighted image in determining the molecular subtype of breast cancer. J Comput Assist Tomogr 2021; 45 (05) 711-716
- 19 Galati F, Luciani ML, Caramanico C, Moffa G, Catalano C, Pediconi F. Breast magnetic resonance spectroscopy at 3 T in biopsy-proven breast cancers: does choline peak correlate with prognostic factors?. Invest Radiol 2019; 54 (12) 767-773
- 20 Ren W, Xi X, Zhang X. et al. Predicting molecular subtypes of breast cancer based on multi-parametric MRI dataset using deep learning method. Magn Reson Imaging 2025; 117: 110305
- 21 Zhao M, Fu K, Zhang L. et al. Intravoxel incoherent motion magnetic resonance imaging for breast cancer: a comparison with benign lesions and evaluation of heterogeneity in different tumor regions with prognostic factors and molecular classification. Oncol Lett 2018; 16 (04) 5100-5112
- 22 Youk JH, Son EJ, Chung J, Kim JA, Kim EK. Triple-negative invasive breast cancer on dynamic contrast-enhanced and diffusion-weighted MR imaging: comparison with other breast cancer subtypes. Eur Radiol 2012; 22 (08) 1724-1734
- 23 Moffa G, Galati F, Collalunga E. et al. Can MRI biomarkers predict triple-negative breast cancer?. Diagnostics (Basel) 2020; 10 (12) 1090
- 24 Heacock L, Lewin AA, Gao Y. et al. Feasibility analysis of early temporal kinetics as a surrogate marker for breast tumor type, grade, and aggressiveness. J Magn Reson Imaging 2018; 47 (06) 1692-1700
- 25 Gelezhe PB, Blokhin IA, Marapov DI, Morozov SP. Quantitative parameters of MRI and 18F-FDG PET/CT in the prediction of breast cancer prognosis and molecular type: an original study. Am J Nucl Med Mol Imaging 2020; 10 (06) 279-292
- 26 Li X, Fu P, Jiang M. et al. The diagnostic performance of dynamic contrast-enhanced MRI and its correlation with subtypes of breast cancer. Medicine (Baltimore) 2021; 100 (51) e28109
- 27 Liu L, Mei N, Yin B, Peng W. Correlation of DCE-MRI perfusion parameters and molecular biology of breast infiltrating ductal carcinoma. Front Oncol 2021; 11: 561735
- 28 Montemezzi S, Camera L, Giri MG. et al. Is there a correlation between 3T multiparametric MRI and molecular subtypes of breast cancer?. Eur J Radiol 2018; 108: 120-127
- 29 Sah RG, Sharma U, Parshad R, Seenu V, Mathur SR, Jagannathan NR. Association of estrogen receptor, progesterone receptor, and human epidermal growth factor receptor 2 status with total choline concentration and tumor volume in breast cancer patients: an MRI and in vivo proton MRS study. Magn Reson Med 2012; 68 (04) 1039-1047
- 30 Sharma P, Kumar I, Ojha R, Khanna S, Verma A. Prediction of genetic profile of breast carcinoma on MRI using a combination of DCE-MRI, DWI, and MR spectroscopy: a prospective observational study. Malig Spect 2024; 1 (04) 291-301
Address for correspondence
Publication History
Article published online:
05 February 2026
© 2026. Indian Radiological Association. This is an open access article published by Thieme under the terms of the Creative Commons Attribution-NonDerivative-NonCommercial License, permitting copying and reproduction so long as the original work is given appropriate credit. Contents may not be used for commercial purposes, or adapted, remixed, transformed or built upon. (https://creativecommons.org/licenses/by-nc-nd/4.0/)
Thieme Medical and Scientific Publishers Pvt. Ltd.
A-12, 2nd Floor, Sector 2, Noida-201301 UP, India
-
References
- 1 Sung H, Ferlay J, Siegel RL. et al. Global Cancer Statistics 2020: GLOBOCAN estimates of incidence and mortality worldwide for 36 cancers in 185 countries. CA Cancer J Clin 2021; 71 (03) 209-249
- 2 Polyak K. Heterogeneity in breast cancer. J Clin Invest 2011; 121 (10) 3786-3788
- 3 Goldhirsch A, Wood WC, Coates AS, Gelber RD, Thürlimann B, Senn HJ. Panel members. Strategies for subtypes–dealing with the diversity of breast cancer: highlights of the St. Gallen International Expert Consensus on the Primary Therapy of Early Breast Cancer 2011. Ann Oncol 2011; 22 (08) 1736-1747
- 4 Yersal O, Barutca S. Biological subtypes of breast cancer: prognostic and therapeutic implications. World J Clin Oncol 2014; 5 (03) 412-424
- 5 Yetkin Dİ, Akpınar MG, Durhan G, Demirkazik FB. Comparison of clinical and magnetic resonance imaging findings of triple-negative breast cancer with non-triple-negative tumours. Pol J Radiol 2021; 86: e269-e276
- 6 Costantini M, Belli P, Distefano D. et al. Magnetic resonance imaging features in triple-negative breast cancer: comparison with luminal and HER2-overexpressing tumors. Clin Breast Cancer 2012; 12 (05) 331-339
- 7 Li W, Yu K, Feng C, Zhao D. Molecular subtypes recognition of breast cancer in dynamic contrast-enhanced breast magnetic resonance imaging phenotypes from radiomics data. Comput Math Methods Med 2019; 2019: 6978650
- 8 Muthuvel D, Mohakud S, Deep N. et al. Usefulness of combined advanced dynamic contrast-enhanced and diffusion-weighted MRI over ultrasonography in differentiating cancer from benign lesions in dense breasts. Cureus 2024; 16 (09) e69634
- 9 Hammond ME, Hayes DF, Dowsett M. et al. American Society of Clinical Oncology/College of American Pathologists guideline recommendations for immunohistochemical testing of estrogen and progesterone receptors in breast cancer. J Clin Oncol 2010; 28 (16) 2784-2795
- 10 Galati F, Rizzo V, Trimboli RM, Kripa E, Maroncelli R, Pediconi F. MRI as a biomarker for breast cancer diagnosis and prognosis. BJR Open 2022; 4 (01) 20220002
- 11 Sharma U, Agarwal K, Hari S. et al. Role of diffusion weighted imaging and magnetic resonance spectroscopy in breast cancer patients with indeterminate dynamic contrast enhanced magnetic resonance imaging findings. Magn Reson Imaging 2019; 61: 66-72
- 12 Yang Z, Chen X, Zhang T. et al. Quantitative multiparametric MRI as an imaging biomarker for the prediction of breast cancer receptor status and molecular subtypes. Front Oncol 2021; 11: 628824
- 13 Chen H, Li W, Wan C, Zhang J. Correlation of dynamic contrast-enhanced MRI and diffusion-weighted MR imaging with prognostic factors and subtypes of breast cancers. Front Oncol 2022; 12: 942943
- 14 Gigli S, Amabile MI, David E. et al. Morphological and semiquantitative kinetic analysis on dynamic contrast enhanced MRI in triple negative breast cancer patients. Acad Radiol 2019; 26 (05) 620-625
- 15 Szep M, Pintican R, Boca B. et al. Multiparametric MRI features of breast cancer molecular subtypes. Medicina (Kaunas) 2022; 58 (12) 1716
- 16 Elmaghraby A, Soliman B, Zaiton F, Nawar N, Altaher K. Correlation between multiparametric magnetic resonance imaging (MRI) descriptors and breast cancer molecular subtypes. Zagazig Univ Med J 2024; 30 (1.2): 389-400
- 17 Dilorenzo G, Telegrafo M, La Forgia D, Stabile Ianora AA, Moschetta M. Breast MRI background parenchymal enhancement as an imaging bridge to molecular cancer sub-type. Eur J Radiol 2019; 113: 148-152
- 18 You C, Zhang Y, Chen Y. et al. Evaluation of background parenchymal enhancement and histogram-based diffusion-weighted image in determining the molecular subtype of breast cancer. J Comput Assist Tomogr 2021; 45 (05) 711-716
- 19 Galati F, Luciani ML, Caramanico C, Moffa G, Catalano C, Pediconi F. Breast magnetic resonance spectroscopy at 3 T in biopsy-proven breast cancers: does choline peak correlate with prognostic factors?. Invest Radiol 2019; 54 (12) 767-773
- 20 Ren W, Xi X, Zhang X. et al. Predicting molecular subtypes of breast cancer based on multi-parametric MRI dataset using deep learning method. Magn Reson Imaging 2025; 117: 110305
- 21 Zhao M, Fu K, Zhang L. et al. Intravoxel incoherent motion magnetic resonance imaging for breast cancer: a comparison with benign lesions and evaluation of heterogeneity in different tumor regions with prognostic factors and molecular classification. Oncol Lett 2018; 16 (04) 5100-5112
- 22 Youk JH, Son EJ, Chung J, Kim JA, Kim EK. Triple-negative invasive breast cancer on dynamic contrast-enhanced and diffusion-weighted MR imaging: comparison with other breast cancer subtypes. Eur Radiol 2012; 22 (08) 1724-1734
- 23 Moffa G, Galati F, Collalunga E. et al. Can MRI biomarkers predict triple-negative breast cancer?. Diagnostics (Basel) 2020; 10 (12) 1090
- 24 Heacock L, Lewin AA, Gao Y. et al. Feasibility analysis of early temporal kinetics as a surrogate marker for breast tumor type, grade, and aggressiveness. J Magn Reson Imaging 2018; 47 (06) 1692-1700
- 25 Gelezhe PB, Blokhin IA, Marapov DI, Morozov SP. Quantitative parameters of MRI and 18F-FDG PET/CT in the prediction of breast cancer prognosis and molecular type: an original study. Am J Nucl Med Mol Imaging 2020; 10 (06) 279-292
- 26 Li X, Fu P, Jiang M. et al. The diagnostic performance of dynamic contrast-enhanced MRI and its correlation with subtypes of breast cancer. Medicine (Baltimore) 2021; 100 (51) e28109
- 27 Liu L, Mei N, Yin B, Peng W. Correlation of DCE-MRI perfusion parameters and molecular biology of breast infiltrating ductal carcinoma. Front Oncol 2021; 11: 561735
- 28 Montemezzi S, Camera L, Giri MG. et al. Is there a correlation between 3T multiparametric MRI and molecular subtypes of breast cancer?. Eur J Radiol 2018; 108: 120-127
- 29 Sah RG, Sharma U, Parshad R, Seenu V, Mathur SR, Jagannathan NR. Association of estrogen receptor, progesterone receptor, and human epidermal growth factor receptor 2 status with total choline concentration and tumor volume in breast cancer patients: an MRI and in vivo proton MRS study. Magn Reson Med 2012; 68 (04) 1039-1047
- 30 Sharma P, Kumar I, Ojha R, Khanna S, Verma A. Prediction of genetic profile of breast carcinoma on MRI using a combination of DCE-MRI, DWI, and MR spectroscopy: a prospective observational study. Malig Spect 2024; 1 (04) 291-301