

Subscribe to RSS
DOI: 10.1055/s-0045-1811652
Mechanisms of Forsythia suspensa Extract Against IgA Nephropathy through Network Pharmacology and Experimental Validation
Authors
Funding This study was supported by the Natural Science Foundation of China (82560923), Natural Science Foundation of Inner Mongolia (2019MS08008), Natural Science Foundation of Inner Mongolia Joint Program (2023LHMS08075), and General Project of Inner Mongolia Medical University (YKD2025MS026).

Abstract
Objective
Forsythia suspensa has long been utilized in traditional Chinese medicine (TCM) for the treatment of IgA nephropathy (IgAN), the most prevalent form of primary glomerular disease. However, the precise mechanisms remain inadequately understood. This study seeks to elucidate the underlying mechanisms of Forsythia suspensa extract (FSE) in the treatment of IgAN by employing an integrated approach that combines network pharmacology with in vivo experimental validation.
Methods
The chemical components of FSE were identified using high-performance liquid chromatography-mass spectrometry (HPLC–MS/MS). Additional chemical components and targets were determined through the Traditional Chinese Medicine Systems Pharmacology database. Potential therapeutic targets for IgAN were sourced from GeneCards and the Comparative Toxicogenomics Database. Subsequently, the enrichment analyses were conducted to evaluate the biological functions and pathways associated with the core targets. Finally, a mouse model of IgAN was developed to validate the findings of the network pharmacology analysis.
Results
Through network analysis and HPLC–MS/MS, 31 chemical components of FSE were identified. A total of 99 common targets were discovered between FSE and IgAN. The enrichment analyses suggested that FSE may mitigate IgAN primarily by inhibiting the TLR and NF-κB signaling pathways. In vivo experiments demonstrated that FSE reduced inflammation and preserved renal function in mice with IgAN through the Toll-like receptor 9 (TLR9)/NF-κB pathway.
Conclusion
The integration of network pharmacology and animal experiments suggests that FSE alleviates renal inflammation and damage in IgAN through the TLR9/NF-κB signaling pathway.
Keywords
Forsythia suspensa extract - IgA nephropathy - TLR9/NF-κB signaling pathway - network pharmacology - experimental validationIntroduction
IgA nephropathy (IgAN) is the most prevalent form of primary glomerular disease and significantly contributes to the global incidence of end-stage renal disease (ESRD).[1] Characterized by the excessive accumulation of IgA, often alongside IgG, IgM, and complement C3, in the mesangial region of the glomerulus, IgAN leads to mesangial cell proliferation and increased synthesis of the extracellular matrix. Clinically, IgAN presents a wide spectrum of manifestations, ranging from asymptomatic urinary abnormalities to rapidly progressing glomerulonephritis with kidney failure.[2] Approximately 30 to 40% of patients with IgAN progress to ESRD within 20 years of initial diagnosis.[3] Current treatment protocols, as outlined by the KDIGO 2021 guidelines, emphasize strict blood pressure control and effective blockade of the renin–angiotensin–aldosterone system. For patients at high risk of progressive IgAN, immunosuppressants may be considered, although their potential benefits must be weighed against possible adverse reactions.[4]
Traditional Chinese medicine (TCM) has a long history of use in China, spanning thousands of years, and is recognized for its unique advantages in treating chronic kidney disease, as supported by clinical evidence.[5] Forsythia suspensa (Thunb.) Vahl, a prominent herb in TCM, is utilized for its properties in clearing heat, removing toxins, alleviating swelling, dispersing lumps, and protecting the kidneys.[6] The dried fruit of Forsythia suspensa is characterized by a bitter taste and a slightly cold nature. It is commonly employed in TCM to reduce throat pain and swelling and is widely used in treating upper respiratory tract infections. As mucosal infection is closely related to the occurrence and development of IgAN, Forsythia suspensa or formulas containing Forsythia suspensa have been used to treat IgAN in clinical settings. Modern pharmacological studies have demonstrated that Forsythia suspensa extract (FSE) possesses anti-inflammatory and immunomodulatory effects, influencing both specific and nonspecific immunity.[7] While some studies have reported its effectiveness in treating IgAN, the precise mechanism of Forsythia suspensa in IgAN remains unclear.
Chinese herbs are characterized by their “multi-component” “multi-target” and “multi-pathway” properties. To predict the mechanisms of Chinese herbs, network pharmacology is employed, which combines pharmacology with systems biology approaches. In this study, we utilized a combination of network pharmacology and in vivo experimental validation to investigate the chemical components and mechanisms of FSE in treating IgAN. The workflow of our study is illustrated in the graphical abstract presented in [Fig. 1].

Methods
Network Pharmacology-Based Analysis
Identification of Chemical Components of Forsythia suspensa Extract via High-Performance Liquid Chromatography–Mass Spectrometry
The analysis of caffeic acid, ferulic acid, citric acid, luteolin, rutin, tannic acid, quercetin, luteolin, and FSE was conducted using high-performance liquid chromatography–mass spectrometry (HPLC-MS/MS) on a triple quadrupole LC-MS 8045 system (Shimadzu Corporation, Japan). This system was equipped with a Shim-pack GIST-HP C18 column (2.1 mm × 100 mm, 3 μm). Methanol served as mobile phase A, whereas mobile phase B consisted of an aqueous solution containing 0.1% formic acid. The gradient elution program was structured as follows: from 0 to 5 minutes, 5% A was maintained; from 5 to 11 minutes, the gradient increased from 5 to 34% A; from 11 to 15 minutes, it further increased to 60% A; from 15 to 19 minutes, it rose to 70% A; from 19 to 25 minutes, it reached 85% A; from 25 to 35 minutes, it was elevated to 95% A; and from 35 to 40 minutes, 95% A was maintained. The flow rate was set at 0.35 mL/min, with the column temperature maintained at 35°C and an injection volume of 5 μL. Detection was achieved using an electrospray ionization (ESI) source, operating in both positive and negative ion modes. The full MS/ddMS2 detection mode was employed, with a full MS resolution of 70,000 and a ddMS2 resolution of 17,500. The scanning range was set between 110 and 1,200 m/z, and the collision energy was maintained at 30 eV. The spray voltage was 3.80 kV for positive ion mode and 3.20 kV for negative ion mode. The ion transfer tube temperature was 300°C for positive mode and 400°C for negative mode. Additionally, the auxiliary gas temperature was maintained at 350°C, with a flow rate of 30 L/min.
Identification of Potential Drug and Disease Targets
The chemical components of FSE were identified by integrating the results from HPLC-MS/MS analysis with data from the Traditional Chinese Medicine Systems Pharmacology Database and Analysis Platform (TCMSP, http://lsp.nwu.edu.cn/tcmsp.php). In the TCMSP database, these components were selected based on the criteria of oral bioavailability of ≥30% and drug-likeness of ≥0.18. Following this, the Swiss Target Prediction database (http://www.swisstargetprediction.ch/) was employed to forecast the potential targets of the active components of FSE. Concurrently, the targets associated with IgAN were identified using the GeneCards (https://www.genecards.org/) and Comparative Toxicogenomics Database (http://ctdbase.org/), with “IgA nephropathy” and “Berger's disease” as search keywords. Subsequently, all identified target genes were deduplicated, normalized, and then imported into the UniProt database (https://www.uniprot.org/) to acquire their corresponding UniProt IDs.
Construction of a Protein–Protein Network of Common Targets of Forsythia suspensa extract and IgA Nephropathy
To visualize the overlapping targets of FSE and IgAN, a Venn diagram was constructed using the online platform Wei Sheng Xin (http://www.bioinformatics.com.cn/). The identified target genes were then imported into the STRING database (https://cn.string-db.org/) to construct a protein–protein interaction (PPI) network specifically for “Homo sapiens.” This network was subsequently visualized using Cytoscape software (version 3.9.1). To evaluate the network topology parameters, such as degree, betweenness, and closeness, the Cyto NCA plugin was employed. Key targets were identified as those genes with a degree value equal to or greater than the median.
Gene Ontology and Kyoto Encyclopedia of Genes and Genomes Enrichment Analyses
The common targets of FSE and IgAN were imported into the Metascape database (https://metascape.org) for Gene Ontology (GO) and Kyoto Encyclopedia of Genes and Genomes (KEGG) enrichment analyses. Significantly enriched GO terms (cellular components [CCs], molecular functions [MFs], and biological processes [BPs]) and KEGG pathways were identified based on the following screening criteria: min overlap = 3, p-value = 0.01, and min enrichment = 15. The results were imported into Wei Sheng Xin (http://www.bioinformatics.com.cn/) for visualization.
Experimental Validation
Reagents
Fosinopril sodium tablets (Monopril) were obtained from Sino-American Shanghai Squibb Pharmaceuticals Ltd. (import drug registration number: H19980197). Lipopolysaccharide (LPS) (Sigma number: L2630) and bovine serum albumin (BSA) (Sigma number: A8020) were obtained from Sigma (United States). A hematoxylin and eosin (H&E) staining kit, a sodium dodecyl sulfate–polyacrylamide gel electrophoresis (SDS-PAGE) gel preparation kit, and a TriQuick total RNA extraction kit were obtained from Solarbio Biotechnology Co., Ltd. (Beijing, China). A DAB staining kit was obtained from Boster Biological Engineering Co., Ltd. (Wuhan, China) (number: DAB-0031). ELISA kits for detecting tumor necrosis factor-α (TNF-α) and interleukin-6 (IL-6) were obtained from Enzyme Immunity Industry Co., Ltd. (Jiangsu, China) (number: MM-0132M1 and MM-0163M1). Anti-MyD88, anti-TLR9, anti-NF-κB, anti-IRAK4, anti-P38MAPK, and anti-ERK antibodies were obtained from Santa Cruz Biotechnology, Inc. (Wuhan, China). Anti-GAPDH, anti-Dylight 800, goat anti-rabbit IgG and Dylight 800, goat anti-mouse IgG were obtained from Affinity Biosciences (Jiangsu, China).
Animal Experiments
Animal Model of IgA Nephropathy
A total of 60 male Kunming mice (age: 8 weeks; weight: 20–25 g) were obtained from the Animal Experimental Center of Inner Mongolia Medical University (Hohhot, China). All animal experiments were approved by the Experimental Animal Ethics Committee of Inner Mongolia Medical University (approval number: YKD202301208). The mice were housed in a controlled environment with a 12-hour light/12-hour dark cycle at 23°C. After 7 days of adaptive prefeeding, the mice were randomly divided into the following six groups, with 10 mice in each group: control, IgAN, low-concentration FSE (FSE-L), medium-concentration FSE (FSE-M), high-concentration FSE (FSE-H), and fosinopril sodium (FOS). Mouse models of IgAN were established via oral mucosal immunization. These mice were administered 0.4 mL of 0.1% BSA (in water) via gavage every other day for 8 weeks. In addition, 0.4 mL of a CCL4–castor oil (1:5) solution was subcutaneously injected once a week and 0.05 mg of LPS was administered via tail vein injection at the end of weeks 6 and 8. Mice in the control group were administered an equal amount of saline via gavage, castor oil via subcutaneous injection, and saline via tail vein injection for the same duration as the IgAN group.[8] At the end of week 8, the successful establishment of IgAN mouse models was validated by positive immunofluorescence (IF) of glomerular IgA.
Treatments
In this study, mice in the FSE-L, FSE-M, and FSE-H groups received FSE at doses of 25, 50, and 100 mg/kg/d, respectively, while those in the FOS group were administered 0.026 mg/kg/d FOS.[9] The control and IgAN groups were given normal saline at the equivalent dose. After an 8-week treatment period, urine samples were collected from each mouse using metabolic cages. Subsequently, all mice were euthanized via cervical dislocation, and blood, urine, and kidney tissue samples were collected for further analysis.
Measurement of Body Weight and Renal Function in Mice with IgA Nephropathy
The body weight of mice in each group was recorded at 0, 4, 8, 12, and 16 weeks, and the data were subsequently subjected to statistical analysis. To evaluate renal function, the 24-hour urine protein (24 h-UTP) content was quantified using a fully automated biochemical analyzer (Respons910). Furthermore, blood urea nitrogen (BUN) and serum creatinine (Scr) levels were measured to provide additional indicators of kidney function.
Determination of Serum Levels of Tumor Necrosis Factor-α and Interleukin-6 using ELISA
The levels of TNF-α and IL-6 in mouse serum were measured using corresponding ELISA kits.
Histological Analysis of Mouse Kidney Tissue
Mouse kidney tissues were fixed in 10% formaldehyde for 48 hours, dehydrated in a graded series of alcohol solutions, embedded in paraffin, and cut into 3-μm-thick sections using a rotary microtome. The sections were dewaxed in xylene, rehydrated with progressively decreasing alcohol concentrations in water, and sequentially stained with H&E. The stained sections were examined and photographed under a light microscope (magnification × 200).
Immunofluorescence Assay
IgA deposition in the glomerular mesangial region was assessed via IF staining. The protocol for IF staining for IgA comprised the following steps: ① Dewaxing and HE staining were performed according to standard laboratory procedures. ② Antigen retrieval was achieved by incubating tissue sections in EDTA alkaline repair solution at 95°C for 20 minutes, with an oil pen used to demarcate the kidney region on each glass slide. Slides were then washed three times for 3 minutes each with phosphate-buffered saline (PBS) solution to remove residual retrieval solution. ③ To minimize background fluorescence, sections were treated dropwise with a spontaneous fluorescence quencher at room temperature for 5 minutes, followed by a ten-minute wash with tap water. ④ Nonspecific antibody binding was blocked by incubating sections with 3% BSA at room temperature for 30 minutes. ⑤ Sections were then incubated overnight at 4°C with a primary antibody against IgA (dilution 1:1000), followed by three washes with PBS for 3-minute each. ⑥ Subsequently, sections were incubated with a secondary antibody at room temperature in the dark for 60 minutes, followed by three washes with PBS for 3-minute each. ⑦ Nuclei were counterstained by applying DAPI staining solution dropwise and incubating at room temperature in the dark for 10 minutes, followed by three washes with PBS for 3-minute each. ⑧ Finally, slides were sealed with an antifluorescence quenching mounting medium and visualized using fluorescence microscopy for image acquisition.
Immunohistochemical Analysis
Mouse tissue sections were dewaxed in xylene, dehydrated in a graded series of alcohol solutions, embedded in paraffin, and incubated with citrate buffer for antigen retrieval. The tissue sections were treated with 3% hydrogen peroxide to block and incubated with primary antibodies (dilution 1:1000) overnight at 4°C. The following day, the tissue sections were washed with PBS, incubated with secondary antibodies, and exposed to an ECL substrate. Image Pro Plus (version 6.0) (Media Cybernetics, Silver Spring, Maryland, United States) was used to analyze images to quantify the expression of TLR9 and p-P38 MAPK in kidney tissues.
Quantitative Reverse Transcription Polymerase Chain Reaction
Total RNA was extracted from mouse kidney tissues using a TriQuick RNA extraction kit according to the manufacturer's instructions. Complementary DNA (cDNA) was synthesized through reverse transcription after quantifying the extracted RNA. Quantitative polymerase chain reaction (PCR) was performed using the cDNA as a template, and the expression levels of target genes relative to the internal reference were calculated. Stage 1 (predenaturation at 95°C for 30 seconds), Stage 2 (PCR reaction at 95°C for 5 seconds, 60°C for 34 seconds, a total of 40 cycles), Stage 3 (95°C for 15 seconds, 60°C for 1 minute, 95°C for 15 seconds). The primer sequences used for PCR are shown in [Table 1].
Western Blotting
Total protein was extracted from mouse kidney tissues and quantified using a bicinchoninic acid protein assay kit. A total of 30 μg of protein extract/lane was separated via SDS-PAGE at 80 V for 0.5 hour and 120 V for another 1 hour. The separated proteins were electrotransferred to a 0.20-μm polyvinylidene fluoride membrane. The film was activated with methanol and immersed in the transfer solution. Following the completion of the film transfer, the film should be placed into a sealing solution and sealed for 30 minutes. The membrane was incubated with primary antibodies (anti-TLR9 [1:1000], anti-MyD88 [1:1000], anti-IRAK4 [1:1000], anti-NF-κB [1:1000], anti-P38 MAPK [1:1000], anti-ERK [1:1000], and anti-GAPDH [1:2000]) overnight at 4°C. The following day, the membrane was incubated with secondary antibodies for 2 hours at room temperature. Finally, the gray values of the resulting protein bands were analyzed using the ImageJ software.
Statistical Analysis
One-way analysis of variance or Student's t-test was used for statistical analysis. The results were expressed as the mean ± standard deviation. The GraphPad Prism (version 9.0) and SPSS (version 25.0) software were used for data analysis. A p-value of <0.05 indicated statistical significance.
Results
Active Components of Forsythia suspensa Extract Identified via High-Performance Liquid Chromatography–Mass Spectrometry
To ensure the stability of FSE, a qualitative and quantitative analysis of its chemical components was conducted using HPLC-MS/MS. The extracted ion chromatograms (EICs) for FSE, displayed in both ESI− and ESI+ modes, are presented in [Fig. 2A, B]. The identification of the peaks in these EICs was accomplished by examining retention times, high-resolution mass data, and MS/MS fragments, utilizing information from related studies and known fragmentation patterns. Ultimately, 31 chemical components were successfully identified in FSE, as detailed in [Supplementary Table S1] (available in online version only).

Active Components and Targets of Forsythia suspensa Extract Obtained from Traditional Chinese Medicine Systems Pharmacology Database and Analysis Platform
24 chemical components of FSE and their 225 targets were identified from TCMSP ([Supplementary Table S2], available in online version only). These targets were converted into gene names using the UniProt database.
Targets of Forsythia suspensa Extract for the Treatment of IgA Nephropathy
A total of 1,315 IgAN targets were obtained from GeneCards and CTD. By intersecting these with FSE targets using a Venn diagram, 99 common targets were identified ([Fig. 3A]).


Drug Component–Target Network and Protein–Protein Interaction Network
To construct a drug component–target network, the chemical components of FSE and their 225 potential targets were imported into Cytoscape (version 3.10.1) software ([Fig. 3B]). Among the 225 therapeutic targets, several, such as TNF, IL-6, JUN, MMP9, NF-κB, AKT1, CASP3, and IL-1, exhibited high expression levels and were associated with multiple components. Additionally, the 99 common targets shared by FSE and IgAN were imported into STRING to construct a PPI network, which was screened using a confidence level of >0.9. This PPI network comprised 104 nodes and 2,863 edges. In the network, the degree values were represented by node size and color shading, with the orange center node highlighting the top 10 targets: TNF, PTGS2, NF-κB1, MMP9, JUN, IL-6, IL-1B, CASP3, AKT1, and TP53 ([Fig. 3C]).
Gene Ontology and Kyoto Encyclopedia of Genes and Genomes Functional Enrichment Analyses
The top 10 targets identified from the PPI network were subjected to GO and KEGG enrichment analyses using the Metascape database. As depicted in [Fig. 3D], the GO analysis revealed that these target genes were enriched in BPs such as inflammatory responses, leukocyte migration, positive regulation of phosphorylation, and response to chemokines. Additionally, the CCs identified included the vesicle lumen, cytoplasmic vesicle lumen, Bcl-2 family protein complex, and CD40 receptor complex. The MFs associated with these genes comprised DNA-binding transcription factor activity, chemokine receptor activity, cytokine receptor activity, and receptor–ligand activity. Furthermore, [Fig. 3E] illustrates that the target genes were enriched in 20 KEGG pathways, notably including the Toll-like receptor, NF-κB, TNF, PI3K-Akt, and apoptosis signaling pathways.
Protective Effects of Forsythia suspensa Extract in Mice with IgA Nephropathy
In the IgAN group, a continuous decrease in body weight was observed after week 8, whereas the three FSE treatment groups exhibited a gradual increase in body weight. Notably, the body weight of mice in the IgAN group was significantly lower than that of the control group (p < 0.01; [Fig. 4A, B]). In terms of urinary protein excretion, the IgAN group showed significantly higher 24 h-UTP levels compared with the control group (p < 0.01). Conversely, all FSE treatment groups demonstrated significantly lower 24 h-UTP levels than the IgAN group, with the FSE-H group exhibiting the lowest levels ([Fig. 4C]). Additionally, compared with the IgAN group, each treatment group displayed significantly reduced levels of BUN and Scr (p < 0.01) ([Fig. 4D, E]). Histological analysis through H&E staining revealed that the kidney tissues of mice in the IgAN group suffered from glomerular atrophy, capillary endothelial hyperplasia, tubular cell swelling, and inflammatory cell infiltration. However, these pathological changes were markedly less severe in the FSE treatment groups ([Fig. 5A]). Furthermore, the FSE-M and FSE-H groups exhibited significantly reduced IgA accumulation in the glomeruli compared with the IgAN group (p < 0.01; [Fig. 5B, G]).


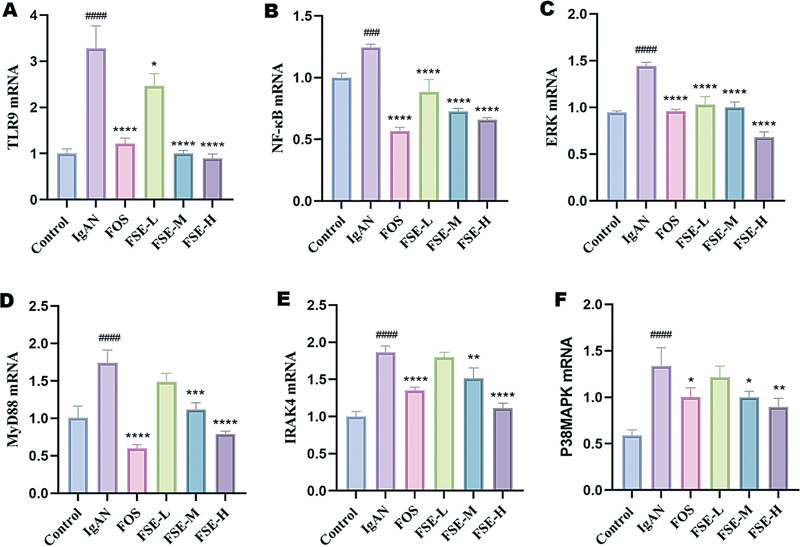
Compared with the IgAN group, the three FSE groups had lower serum levels of TNF-ɑ and IL-6 (p < 0.01; [Fig. 4F–G]).The mRNA expression levels of TLR9, MyD88, IRAK4, NF-κB, ERK, and P38 MAPK were significantly elevated in the kidney tissues of mice in the IgAN group, as depicted in [Fig. 6A–F]. Notably, the FSE-L, FSE-M, and FSE-H groups exhibited reduced mRNA expression levels of TLR9, NF-κB, and ERK (p < 0.01). Furthermore, the FSE-M and FSE-H groups showed decreased mRNA expression levels of MyD88, IRAK4, and P38 MAPK (p < 0.01). Immunohistochemical analysis confirmed that TLR9 and P38 MAPK expression levels were significantly higher in the IgAN group (p < 0.01); however, treatment with FSE and FOS effectively mitigated this increase (p < 0.01), as illustrated in [Fig. 5C–F]. Additionally, protein expression levels of TLR9, IRAK4, ERK, and P38 MAPK were significantly lower in the FOS, FSE-M, and FSE-H groups, whereas NF-κB levels were markedly reduced in the FOS and FSE-H groups (p < 0.01), as shown in [Fig. 7A–G]. These findings suggest that FSE alleviates inflammation in mice with IgAN, potentially through modulation of the TLR9/NF-κB signaling pathway.

Discussion
IgAN is an autoimmune kidney disease characterized by painless gross hematuria and persistent microscopic hematuria, with or without proteinuria. Its main pathological feature is the deposition of IgA in the mesangial region of the glomerulus. The pathogenesis of IgAN is very complex, and inflammation caused by abnormal mucosal immune responses is considered one of the main causes. The treatment of IgAN mainly focuses on attenuating inflammatory reactions and alleviating symptoms with immunosuppressants or renin–angiotensin–aldosterone system inhibitors. However, drawbacks include a recurrence rate and notable side effects. Owing to its multitarget, multicomponent, and multipathway characteristics, TCM has been shown to have a definite therapeutic effect on IgAN. Therefore, TCM holds promise in improving the treatment of IgAN in clinical settings. Forsythia suspensa has been utilized in TCM for centuries to clear heat and dampness, promote urination, and reduce swelling. Despite its long history of use, research specifically examining the effects of Forsythia suspensa on IgAN remains limited. Our previous studies have demonstrated that a TCM formula containing FSE can exert therapeutic effects against IgAN by modulating inflammation-related pathways. In the current study, we employed network pharmacology to further elucidate the mechanisms of FSE in the context of IgAN.
Based on network pharmacology, we identified 31 chemical components of FSE and 99 target genes common between FSE and IgAN. The PPI network of the common target genes showed that TNF, JUN, MMP9, NF-κB, and IL-6 were among the core targets of FSE ([Fig. 3]). Previous studies have shown that patients with IgAN have higher serum levels of IL-6 and TNF-α than healthy individuals.[10] [11] When TLR9 activates IL-6, it promotes the overproduction of Gd-IgA1, leading to B cell proliferation and the accumulation of renal inflammatory cells, which consequently results in IgAN.[12] In addition, IL-6 can stimulate the proliferation of glomerular mesangial cells and trigger glomerulosclerosis.[13] Patients with IgAN exhibit elevated urinary NF-κB levels, indicating renal injury.[14] Additionally, TNF-α can damage renal podocytes, indicating the renal damage in IgAN, which is thus expected to serve as a non-invasive biomarker.[15]
The results of KEGG pathway enrichment analysis suggested that FSE exerted protective effects against IgAN primarily through the TLR and NF-κB signaling pathways ([Fig. 3]). TLRs play an important role as pattern recognition receptors in recognizing microbial-related molecular patterns and immune responses. Notably, TLR9 is highly expressed in the B cells of IgA nephropathy patients, with studies suggesting that this elevated expression is a risk factor for disease progression.[16] When activated, the TLR9 signaling pathway triggers the secretion of the inflammatory factors, resulting in the deposition of IgA-containing immune complexes in the glomerular mesangium, primarily linked to proteinuria and renal injury.[17] [18] In particular, the mRNA expression of mucosal TLR9 has been associated with hematuria and proteinuria in experimental animal studies.[19] Overactivation of TLR9 induces the production of large amounts of Gd-IgA1, leading to excessive deposition of IgA, IgG, and C3 in the glomerular mesangium, which may result in the development of IgAN.[20] [21] Furthermore, activated TLR9 increases the expression of MyD88 and IRAK4,[22] [23] which subsequently activates the downstream NF-κB signaling pathway,[24] [25] [26] [27] causing the release of inflammatory cytokines such as TNF-α and IL-6.[28] [29] In addition, studies have shown that upregulated IL-6 can activate ERK and P38 MAPK, which in turn promote the release of various chemokines and inflammatory factors, such as IL-6 and TNF-α, thereby triggering renal inflammation in IgAN.[30] [31] [32] Consequently, the TLR9/NF-κB signaling pathway is intricately associated with inflammatory responses, deposition of IgA-containing immune complexes, and kidney injury in IgAN.
Treatment with FSE alleviated kidney damage and reduced the accumulation of IgA-containing immune complexes in mice with IgAN. To assess whether FSE exerted these protective effects by targeting the TLR9/NF-κB signaling pathway, we measured the levels of factors associated with the pathway in mouse kidney tissues. The results showed that the expression levels of TLR9, MyD88, IRAK4, ERK, P38 MAPK, and NF-κB were lower in the FSE-L, FSE-M, and FSE-H groups than in the IgAN group. Furthermore, the levels of TNF-α and IL-6 were significantly lower in the FSE-L, FSE-M, and FSE-H groups compared with the IgAN group. These results indicated that FSE inhibited inflammatory factors to a certain extent, thereby attenuating the inflammatory response in mice with IgAN. These findings suggest that FSE delays IgAN progression by negatively regulating the TLR9/NF-κB signaling pathway ([Fig. 8]). However, further in vitro experiments are needed to determine whether this interaction is direct or indirect.

Conclusion
This study utilized network pharmacology to pinpoint the TLR9/NF-κB signaling pathway as a critical mechanism through which FSE exerts its therapeutic effects in the treatment of IgAN. In a mouse model of IgAN, we further demonstrated the efficacy of FSE, emphasizing its mechanism of action via the TLR9/NF-κB signaling pathway. Specifically, FSE was observed to decrease inflammatory cytokine levels in IgAN-afflicted mice by inhibiting the TLR9/NF-κB pathway, thereby producing substantial anti-inflammatory and renoprotective effects. These findings provide preclinical evidence supporting the therapeutic potential of FSE in managing IgAN.
Conflict of Interest
The authors declare no conflict of interest.
CRediT Authorship Contribution Statement
Yali Xi: Investigation, methodology, data curation, writing–original draft, and writing–review and editing. Yawen Bai: Conceptualization, funding acquisition, project administration, and supervision.
-
References
- 1 Cheung CK, Barratt J, Liew A, Zhang H, Tesar V, Lafayette R. The role of BAFF and APRIL in IgA nephropathy: pathogenic mechanisms and targeted therapies. Front Nephrol 2024; 3: 1346769
- 2 Rajasekaran A, Julian BA, Rizk DV. IgA nephropathy: an interesting autoimmune kidney disease. Am J Med Sci 2021; 361 (02) 176-194
- 3 Rahim SEG, Lin JT, Wang JC. A case of gross hematuria and IgA nephropathy flare-up following SARS-CoV-2 vaccination. Kidney Int 2021; 100 (01) 238
- 4 Coppo R. A disease-modifying approach to the treatment of IgA nephropathy targeting mucosal IgA synthesis and beyond. Kidney Int 2023; 103 (02) 258-261
- 5 Tong X, Chen L, He S. et al. Forsythia suspensa (Thunb.) Vahl extract ameliorates ulcerative colitis via inhibiting NLRP3 inflammasome activation through the TLR4/MyD88/NF-κB pathway. Immun Inflamm Dis 2023; 11 (11) e1069
- 6 Xi YL, Bai YW, Ma CJ. et al. Research on material basis and mechanism of Lianqiao (Forsythiae Fructus) regulating immunity. China Assoc Chi Med 2023; 41 (12) 194-197
- 7 Bai Y, Li Y, Xi Y, Ma C. Identification and validation of glomerulotubular crosstalk genes mediating IgA nephropathy by integrated bioinformatics. BMC Nephrol 2022; 23 (01) 143
- 8 Krata N, Foroncewicz B, Zagożdżon R. et al. Peroxiredoxins as markers of oxidative stress in IgA nephropathy, membranous nephropathy and lupus nephritis. Arch Immunol Ther Exp (Warsz) 2021; 70 (01) 3
- 9 Wang Y, Zhou J, Yuan MM, Zheng XH, Zhang L. [Protective effect of Forsythiae Fructus extract on mice with herpes simplex encephalitis]. Zhongguo Zhongyao Zazhi 2022; 47 (11) 3023-3028
- 10 Sallustio F, Curci C, Chaoul N. et al. High levels of gut-homing immunoglobulin A+ B lymphocytes support the pathogenic role of intestinal mucosal hyperresponsiveness in immunoglobulin A nephropathy patients. Nephrol Dial Transplant 2021; 36 (03) 452-464
- 11 Hou J, Zhang L, Wu H, Gao P, Xu Z. Increased Tim-3+ monocytes/macrophages are associated with disease severity in patients with IgA nephropathy. Int Immunopharmacol 2021; 97: 107666
- 12 Groza Y, Jemelkova J, Kafkova LR, Maly P, Raska M. IL-6 and its role in IgA nephropathy development. Cytokine Growth Factor Rev 2022; 66: 1-14
- 13 Matsumoto K, Kanmatsuse K. Interleukin-17 stimulates the release of pro-inflammatory cytokines by blood monocytes in patients with IgA nephropathy. Scand J Urol Nephrol 2003; 37 (02) 164-171
- 14 Leung JCK, Lai KN, Tang SCW. Role of mesangial-podocytic-tubular cross-talk in IgA nephropathy. Semin Nephrol 2018; 38 (05) 485-495
- 15 Varfolomeev E, Vucic D. Intracellular regulation of TNF activity in health and disease. Cytokine 2018; 101: 26-32
- 16 Kajiyama T, Suzuki Y, Kihara M, Suzuki H, Horikoshi S, Tomino Y. Different pathological roles of toll-like receptor 9 on mucosal B cells and dendritic cells in murine IgA nephropathy. Clin Dev Immunol 2011; 2011: 819646
- 17 Liu Y, Wu Q, Huang Z. et al. TLR4 inhibitor TAK-242 protected henoch-schonlein Purpura nephritis in rats by regulating inflammatory response and immune competence via NF- κB/NLRP3 signalling. Clin Exp Pharmacol Physiol 2025; 52 (01) e70008
- 18 Zhong WT, Wu YC, Xie XX. et al. Phillyrin attenuates LPS-induced pulmonary inflammation via suppression of MAPK and NF-κB activation in acute lung injury mice. Fitoterapia 2013; 90: 132-139
- 19 Xie S, Sun M, Zhang X. et al. T cell responses in immune-mediated IgA nephropathy. J Leukoc Biol 2024; 116 (03) 523-535
- 20 Tian H, Zhai Y, Sun S, Zhang W, Zhao Z. The transcription factor HMGB2 indirectly regulates APRIL expression and Gd-IgA1 production in patients with IgA nephropathy. Ren Fail 2024; 46 (01) 2338931
- 21 Makita Y, Suzuki H, Kano T. et al. TLR9 activation induces aberrant IgA glycosylation via APRIL- and IL-6-mediated pathways in IgA nephropathy. Kidney Int 2020; 97 (02) 340-349
- 22 Lee M, Suzuki H, Ogiwara K. et al. The nucleotide-sensing toll-like receptor 9/toll-like receptor 7 system is a potential therapeutic target for IgA nephropathy. Kidney Int 2023; 104 (05) 943-955
- 23 He B, Santamaria R, Xu W. et al. The transmembrane activator TACI triggers immunoglobulin class switching by activating B cells through the adaptor MyD88. Nat Immunol 2010; 11 (09) 836-845
- 24 Caldi Gomes L, Hänzelmann S, Hausmann F. et al. Multiomic ALS signatures highlight subclusters and sex differences suggesting the MAPK pathway as therapeutic target. Nat Commun 2024; 15 (01) 4893
- 25 Vollmer S, Strickson S, Zhang T. et al. The mechanism of activation of IRAK1 and IRAK4 by interleukin-1 and Toll-like receptor agonists. Biochem J 2017; 474 (12) 2027-2038
- 26 Lin SC, Lo YC, Wu H. Helical assembly in the MyD88-IRAK4-IRAK2 complex in TLR/IL-1R signalling. Nature 2010; 465 (7300): 885-890
- 27 Ma Z, Zhou Y, Wang Y. et al. RNA-binding protein hnRNP UL1 binds κB sites to attenuate NF-κB-mediated inflammation. J Autoimmun 2022; 129: 102828
- 28 Xu L, Zhang P, Guan H. et al. Vitamin D and its receptor regulate lipopolysaccharide-induced transforming growth factor-β, angiotensinogen expression and podocytes apoptosis through the nuclear factor-κB pathway. J Diabetes Investig 2016; 7 (05) 680-688
- 29 Neganova M, Liu J, Aleksandrova Y, Klochkov S, Fan R. Therapeutic influence on important targets associated with chronic inflammation and oxidative stress in cancer treatment. Cancers (Basel) 2021; 13 (23) 6062
- 30 Hook JS, Matheis AD, Kavanaugh JS, Horswill AR, Moreland JG. Role for IRAK-4 and p38 in neutrophil signaling in response to bacterial lipoproteins from Staphylococcus aureus . Inflammation 2025; 48 (04) 1704-1715
- 31 Wang J, Liu Y, Guo Y. et al. Function and inhibition of P38 MAP kinase signaling: targeting multiple inflammation diseases. Biochem Pharmacol 2024; 220: 115973
- 32 Guo Y, Ran Z, Zhang Y. et al. Marein ameliorates diabetic nephropathy by inhibiting renal sodium glucose transporter 2 and activating the AMPK signaling pathway in db/db mice and high glucose-treated HK-2 cells. Biomed Pharmacother 2020; 131: 110684
Address for correspondence
Publication History
Received: 21 April 2025
Accepted: 27 July 2025
Article published online:
30 September 2025
© 2025. The Author(s). This is an open access article published by Thieme under the terms of the Creative Commons Attribution License, permitting unrestricted use, distribution, and reproduction so long as the original work is properly cited. (https://creativecommons.org/licenses/by/4.0/)
Georg Thieme Verlag KG
Oswald-Hesse-Straße 50, 70469 Stuttgart, Germany
-
References
- 1 Cheung CK, Barratt J, Liew A, Zhang H, Tesar V, Lafayette R. The role of BAFF and APRIL in IgA nephropathy: pathogenic mechanisms and targeted therapies. Front Nephrol 2024; 3: 1346769
- 2 Rajasekaran A, Julian BA, Rizk DV. IgA nephropathy: an interesting autoimmune kidney disease. Am J Med Sci 2021; 361 (02) 176-194
- 3 Rahim SEG, Lin JT, Wang JC. A case of gross hematuria and IgA nephropathy flare-up following SARS-CoV-2 vaccination. Kidney Int 2021; 100 (01) 238
- 4 Coppo R. A disease-modifying approach to the treatment of IgA nephropathy targeting mucosal IgA synthesis and beyond. Kidney Int 2023; 103 (02) 258-261
- 5 Tong X, Chen L, He S. et al. Forsythia suspensa (Thunb.) Vahl extract ameliorates ulcerative colitis via inhibiting NLRP3 inflammasome activation through the TLR4/MyD88/NF-κB pathway. Immun Inflamm Dis 2023; 11 (11) e1069
- 6 Xi YL, Bai YW, Ma CJ. et al. Research on material basis and mechanism of Lianqiao (Forsythiae Fructus) regulating immunity. China Assoc Chi Med 2023; 41 (12) 194-197
- 7 Bai Y, Li Y, Xi Y, Ma C. Identification and validation of glomerulotubular crosstalk genes mediating IgA nephropathy by integrated bioinformatics. BMC Nephrol 2022; 23 (01) 143
- 8 Krata N, Foroncewicz B, Zagożdżon R. et al. Peroxiredoxins as markers of oxidative stress in IgA nephropathy, membranous nephropathy and lupus nephritis. Arch Immunol Ther Exp (Warsz) 2021; 70 (01) 3
- 9 Wang Y, Zhou J, Yuan MM, Zheng XH, Zhang L. [Protective effect of Forsythiae Fructus extract on mice with herpes simplex encephalitis]. Zhongguo Zhongyao Zazhi 2022; 47 (11) 3023-3028
- 10 Sallustio F, Curci C, Chaoul N. et al. High levels of gut-homing immunoglobulin A+ B lymphocytes support the pathogenic role of intestinal mucosal hyperresponsiveness in immunoglobulin A nephropathy patients. Nephrol Dial Transplant 2021; 36 (03) 452-464
- 11 Hou J, Zhang L, Wu H, Gao P, Xu Z. Increased Tim-3+ monocytes/macrophages are associated with disease severity in patients with IgA nephropathy. Int Immunopharmacol 2021; 97: 107666
- 12 Groza Y, Jemelkova J, Kafkova LR, Maly P, Raska M. IL-6 and its role in IgA nephropathy development. Cytokine Growth Factor Rev 2022; 66: 1-14
- 13 Matsumoto K, Kanmatsuse K. Interleukin-17 stimulates the release of pro-inflammatory cytokines by blood monocytes in patients with IgA nephropathy. Scand J Urol Nephrol 2003; 37 (02) 164-171
- 14 Leung JCK, Lai KN, Tang SCW. Role of mesangial-podocytic-tubular cross-talk in IgA nephropathy. Semin Nephrol 2018; 38 (05) 485-495
- 15 Varfolomeev E, Vucic D. Intracellular regulation of TNF activity in health and disease. Cytokine 2018; 101: 26-32
- 16 Kajiyama T, Suzuki Y, Kihara M, Suzuki H, Horikoshi S, Tomino Y. Different pathological roles of toll-like receptor 9 on mucosal B cells and dendritic cells in murine IgA nephropathy. Clin Dev Immunol 2011; 2011: 819646
- 17 Liu Y, Wu Q, Huang Z. et al. TLR4 inhibitor TAK-242 protected henoch-schonlein Purpura nephritis in rats by regulating inflammatory response and immune competence via NF- κB/NLRP3 signalling. Clin Exp Pharmacol Physiol 2025; 52 (01) e70008
- 18 Zhong WT, Wu YC, Xie XX. et al. Phillyrin attenuates LPS-induced pulmonary inflammation via suppression of MAPK and NF-κB activation in acute lung injury mice. Fitoterapia 2013; 90: 132-139
- 19 Xie S, Sun M, Zhang X. et al. T cell responses in immune-mediated IgA nephropathy. J Leukoc Biol 2024; 116 (03) 523-535
- 20 Tian H, Zhai Y, Sun S, Zhang W, Zhao Z. The transcription factor HMGB2 indirectly regulates APRIL expression and Gd-IgA1 production in patients with IgA nephropathy. Ren Fail 2024; 46 (01) 2338931
- 21 Makita Y, Suzuki H, Kano T. et al. TLR9 activation induces aberrant IgA glycosylation via APRIL- and IL-6-mediated pathways in IgA nephropathy. Kidney Int 2020; 97 (02) 340-349
- 22 Lee M, Suzuki H, Ogiwara K. et al. The nucleotide-sensing toll-like receptor 9/toll-like receptor 7 system is a potential therapeutic target for IgA nephropathy. Kidney Int 2023; 104 (05) 943-955
- 23 He B, Santamaria R, Xu W. et al. The transmembrane activator TACI triggers immunoglobulin class switching by activating B cells through the adaptor MyD88. Nat Immunol 2010; 11 (09) 836-845
- 24 Caldi Gomes L, Hänzelmann S, Hausmann F. et al. Multiomic ALS signatures highlight subclusters and sex differences suggesting the MAPK pathway as therapeutic target. Nat Commun 2024; 15 (01) 4893
- 25 Vollmer S, Strickson S, Zhang T. et al. The mechanism of activation of IRAK1 and IRAK4 by interleukin-1 and Toll-like receptor agonists. Biochem J 2017; 474 (12) 2027-2038
- 26 Lin SC, Lo YC, Wu H. Helical assembly in the MyD88-IRAK4-IRAK2 complex in TLR/IL-1R signalling. Nature 2010; 465 (7300): 885-890
- 27 Ma Z, Zhou Y, Wang Y. et al. RNA-binding protein hnRNP UL1 binds κB sites to attenuate NF-κB-mediated inflammation. J Autoimmun 2022; 129: 102828
- 28 Xu L, Zhang P, Guan H. et al. Vitamin D and its receptor regulate lipopolysaccharide-induced transforming growth factor-β, angiotensinogen expression and podocytes apoptosis through the nuclear factor-κB pathway. J Diabetes Investig 2016; 7 (05) 680-688
- 29 Neganova M, Liu J, Aleksandrova Y, Klochkov S, Fan R. Therapeutic influence on important targets associated with chronic inflammation and oxidative stress in cancer treatment. Cancers (Basel) 2021; 13 (23) 6062
- 30 Hook JS, Matheis AD, Kavanaugh JS, Horswill AR, Moreland JG. Role for IRAK-4 and p38 in neutrophil signaling in response to bacterial lipoproteins from Staphylococcus aureus . Inflammation 2025; 48 (04) 1704-1715
- 31 Wang J, Liu Y, Guo Y. et al. Function and inhibition of P38 MAP kinase signaling: targeting multiple inflammation diseases. Biochem Pharmacol 2024; 220: 115973
- 32 Guo Y, Ran Z, Zhang Y. et al. Marein ameliorates diabetic nephropathy by inhibiting renal sodium glucose transporter 2 and activating the AMPK signaling pathway in db/db mice and high glucose-treated HK-2 cells. Biomed Pharmacother 2020; 131: 110684