Subscribe to RSS
DOI: 10.1055/s-0044-1788290
Evaluation of the Mechanical Behavior of the Patellar and Semitendinosus Tendons Using Supersonic Shear-wave Imaging (SSI) Elastography and Tensile Tests
Article in several languages: português | EnglishFinancial Support The authors declare that they have not received financial support from agencies in the public, private, or non-profit sectors to conduct the present study.

Abstract
Objective To analyze the mechanical properties of the patellar (PT) and semitendinosus (ST) tendons from fresh-frozen human cadavers from a tissue bank using supersonic shear-wave imaging (SSI) elastography and tensile tests.
Methods We tested seven PT and five ST samples on a traction machine and performed their simultaneous assessment through SSI. The measurements enabled the comparison of the mechanical behavior of the tendons using the stress x strain curve and shear modulus (μ) at rest. In addition, we analyzed the stress x μ relationship under tension and tested the relationship between these parameters. The statistical analysis of the results used unpaired t-tests with Welch correction, the Pearson correlation, and linear regression for the Young modulus (E) estimation.
Results The μ values for the PT and ST at rest were of 58.86 ± 5.226 kPa and 124.3 ± 7.231 kPa respectively, and this difference was statistically significant. The correlation coefficient between stress and μ for the PT and ST was very strong. The calculated E for the PT and ST was of 19.97 kPa and 124.8 kPa respectively, with a statistically significant difference.
Conclusion The ST was stiffer than the PT in the traction tests and SSI evaluations. The μ value was directly related to the stress imposed on the tendon.
Clinical relevance The present is an evaluation of the mechanical properties of the tendons most used as grafts in knee ligament reconstruction surgeries.
Introduction
In recent decades, the mechanical properties of tendons have been widely studied, providing knowledge about their behavior.[1] [2] [3] [4] Recently, the evaluation of the elastic modulus (E) and resistance to failure (RF) of tendon tissues gained importance in the literature.[5] In 2013, LaCroix et al.[5] showed an intimate relationship between these properties despite their conceptual distinction.
Publications on the matter employed several methods to measure these properties, but most carry biases.[3] [6] [7] [8] [9] [10] [11] [12] [13] [14] The results of in-vivo studies are usually obtained indirectly from calculations combining magnetic resonance imaging and ultrasound with data provided by a dynamometer.[10] [13] Several authors[2] [3] [6] [9] [11] [12] [14] have performed ex-vivo analyses of tendons from human and animal cadavers. However, the reliability of these studies is questionable due to the protocol preparation of cadaveric tissues.[10] [15]
We need new analysis methods including in-vivo studies and direct evaluation. Recently, ultrasound with elastography has been widely applied to evaluate tissue stiffness and measure it non-invasively, in real-time, and with less dependency on the operator's skill.[7] [16] [17] [18] [19] [20]
There are different elastography modalities, and the most recent is supersonic shear-wave imaging (SSI).[17] [20] [21] In this method, an acoustic radiation force generates shear waves in the tissue for detection by the ultrasound transducer.[14] [17] [21] The system provides the speed of these waves and the shear modulus (μ) of the tissue, expressing its stiffness.[12] [14] [17] [19] [21]
The SSI is well-established in the evaluation of isotropic media, such as breast, liver, and thyroid tissues.[22] [23] [24] Despite requiring more robust validation, SSI has been used in musculoskeletal tissue, an anisotropic tissue, since the beginning of the last decade, with encouraging results.[1] [6] [7] [8] [16] [18] [19] [20] [25] [26] [27] Due to its anisotropic characteristic, the μ value of the tendon does not present the expected mathematical relationship with E.[14] [17] [21] Even so, recent studies[8] [9] [11] [12] [14] [25] have demonstrated a strong correlation between the μ of the tendon obtained by SSI and its E calculated by the linear phase of the stress x strain graph. However, most of these tests used tendons from other animal species, with low scientific evidence.[9] [11] [12] [14]
There are two studies[8] [25] in the literature comparing ex-vivo mechanical behaviors of human tendons using SSI elastographic analysis. The present study aims to evaluate the mechanical properties of the patellar (PT) and semitendinosus (ST) tendons due to their great relevance and use as grafts in knee ligament reconstruction surgeries[28] using SSI and dynamometry.
The main objective was to obtain and compare the E value from PT and ST at stress by evaluating the stress x strain curve recorded by the traction machine. The secondary objectives were to obtain and compare the μ values of PT and ST in the ultrasound assessment at rest carried out with SSI and to evaluate the influence of tissue stress in SSI-based evaluation, analyzing the correlation between μ values and the stress imposed on these tendons.
Materials and Methods
Ethical approval and study design
The institutional Ethics in Research Committee approved the present cross-sectional study under consubstantiated opinion 1,674,064 (CAAE: 26828914.3.0000.5257). The study was conducted at the Biomechanics Laboratory from 2019 to 2022.
The initial sample was composed of 14 PT and 19 ST samples from fresh-frozen human cadavers provided by the Brazilian Ministry of Health (MH) tissue bank. We received these tendons after they were considered unsuitable for surgical use, mainly due to contamination at some processing stage in the tissue bank. For the most part, the organism detected was Staphylococcus epidermidis, a bacterium that commonly colonizes human skin.
[Tables 1] and [2] show the demographic distribution of the samples.
|
Gender |
N |
Mean age (years) |
|---|---|---|
|
Male |
5 |
28.2 (22–35) |
|
Female |
2 |
28 (26–30) |
|
Gender |
N |
Mean age (years) |
|---|---|---|
|
Male |
4 |
27.5 (22–35) |
|
Female |
1 |
22 |
The fact that tissues preserved in formaldehyde lose their mechanical properties warrants using fresh-frozen human tendons.[2] [15] As such, we asked for samples from the MH since its protocol for preparing musculoskeletal tissues does not involve irradiation, avoiding damage to their biomechanical characteristics.
The inclusion criteria were tendons from fresh-frozen human cadavers aged between 20 and 35 years at the date of death and preserved in a freezer at -80° C at the tissue bank.
The exclusion criteria were signs of degenerative tendon disease, storage time longer than 2 years, presence of macroscopic ruptures, tendon irradiation during preparation by the tissue bank, and inadequate biomechanical or elastographic recording.
After applying the exclusion criteria and the occurrence of accidental damage to the tendons during the pretest preparation, we lost 7 PT and 14 ST samples, and 7 PT and 5 ST samples remained for the final analysis.
Sample preparation
We kept the samples in a freezer at -20° C at the Immunology Laboratory. For testing, the tendons were thawed one hour before at room temperature.
Preparation of the PT started after thawing the anatomical piece provided by the MH, which consisted of the entire knee extensor apparatus, with the quadriceps tendon, patella, patellar tendon, and tibial tuberosity. The pieces for testing were prepared with bone plugs in both PT attachments, with approximately 1.0 cm in each dimension. The intermediate tendinous part was approximately 1.0 cm wide ([Fig. 1]). Each bone plug was drilled with a 2.5-mm drill, generating holes for passing Ethibond 5 wire (Ethicon, Inc., Raritan, NJ, United States).

Processing of the ST occurred before freezing in the tissue bank. Its length was standardized from the myotendinous junction to its tibial attachment. After thawing, we performed a Krakow suture with Ethibond 5 at both ends to optimize anchorage.
Both tendons were placed in the fixation system of the universal testing machine using metal claws ([Fig. 2]).

For the ST, we made two attempts before the definitive fixation to the metal claws. In the first attempt, the tendons were attached directly to the claws, which caused macroscopic structural damage in the first samples and loosening of their ends at the interface with the claws when the tensile test was still beginning. As a result, we abandoned this method. In the second attempt, we anchored the tendons by tying Ethibond 5 directly to plastic tubes attached to the claws. Once again, there were losses due to structural damage to the tissues and the generation of inadequate elastographic or biomechanical readings, so thbis method was also abandoned. After test failures with these two anchoring prototypes, we unfortunately lost 14 ST samples. Finally, to generate more effective fixation between the claw and the ST, we inserted them into plastic tubes, fixated them with Ethibond 5 threads, and attached them with conventional screws to a framework ([Figs. 3] [4]). This last method, deemed ideal and definitive, did not cause any damage or interference in data acquisition.


Elastography
We used the Aixplorer equipment (SuperSonic Imagine, Aix-en-Provence, France) to acquire elastographic images with a linear transducer operating at frequencies ranging from 6 to 20 MHz. Before each test, we carefully aligned the transducer in the same direction as the tendon fibers using B-mode ultrasound ([Fig. 5A]), ensuring μ value determination in the same direction as that of the longitudinal traction.

We activated the elastographic mode using the adapted musculoskeletal (MSK) preset, whose scale ranges from 0 to 800 kPa. The mapping area had a rectangular shape, enabling tendon delimitation. The test started after 10 seconds to stabilize the color mapping of the elastographic images ([Fig. 5B]).
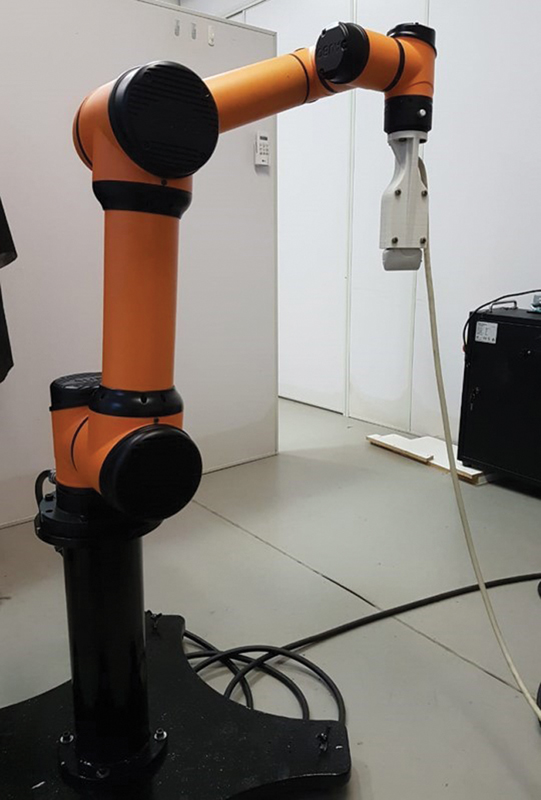
We used an AUBO i5 robotic arm (AUDO Robotics, Beijing, China) ([Figs. 6] [7]) to collect the images, keeping the transducer fixed and immobile over the region of interest (ROI). A gel (Ultrex-gel, Farmativa Indústria e Comércio Ltda., Rio de Janeiro, RJ, Brazil) was used for the acoustic coupling on the tendon surface.


The μ analysis employed a specific routine developed by the Biomechanics Laboratory (trough the Matlab R2013a software, The MathWorks, Inc., Natick, MA, United States). We acquired elastography images until mapping saturation. At that moment, we terminated the video and stress.
Biomechanical testing
We used a BioPDI (São Carlos, SP, Brazil) tensile testing machine with a 5-kN load cell to perform tensioning tests. The temperature and relative humidity in the laboratory during the tests were standardized and kept constant at 23° C and 50% respectively. We attached the ends of the PT and ST samples to the metal claws from the tensioning machine. One end remained fixed, while the other end was progressively pulled at a 1-mm/minute speed on a uniaxial longitudinal axis.
The testing machine values consist of position (mm) and force (N). Using the Matlab software, data underwent a sixth-order Butterworth filtering. We performed an exponential third-order adjustment, ending with 0.5 splines. After the process, we calculated the stress and strain using the previously-measured initial length and cross-sectional area.
Statistical analysis
We calculated descriptive data, such as mean and standard deviation (SD). The Shapiro-Wilk test determined the distribution normality. The t-test for independent groups with Welch correction compared μ values at rest in the PT and ST samples. The Pearson correlation coefficient defined the relationship between μ under stress and tendon stress at moments of the stress x strain curve. Linear regression was performed on the distributions to measure the slope of the curve. E calculation used the slope-1 formula, since stress was selected as the independent variable on the x-axis. Values of p < 0.05 were considered significant. The analyses were performed using the GraphPad Prism (GraphPad Software, Inc., La Jolla, CA, United States) software, version 7.0.
Results
Shear modulus at rest
The initial μ value (with no stress) of the ST was higher compared with that of the PT, which was statistically significant (ST = 124.3 ± 7.231 kPa; and PT = 58.86 ± 5.226; p = 0.0059) ([Fig. 8]).

Correlation between shear modulus and stress
The μ value presented a very strong correlation with stress for both tendons (PT: R = 0.9507; p < 0.0001; and ST: R = 0.9528; p < 0.0001) ([Table 3]).
|
Correlation coefficient (R) |
N |
μ x stress |
p |
|---|---|---|---|
|
Patellar tendon |
7 |
0.9507 (0.839–0.985) |
< 0.0001 |
|
Semitendinosus tendon |
5 |
0.9528 (0.845–0.986) |
< 0.0001 |
Variation of shear modulus under stress
The variation in μ values from ST and TP under stress presented no statistically significant difference (ST: slope of 0.664 ± 0.063 kPa; and PT: 0.872 ± 0.085 kPa; p = 0.065). However, there was a statistically significant difference regarding the μ values of the tendons, especially noted at lower stresses (ST: an increase of 116.8–133.3 kPa; and PT: an increase of 47.14–69.31 kPa; p < 0.0001) ([Fig. 9]).

Percentage of strain under stress and Young modulus
The ST showed significantly higher resistance to deformation than PT (ST: slope of 0.05 ± 0.005; and PT: slope of 0.008 ± 0.0002; p < 0.0001). There was a statistically significant difference between the calculated E of the tendons (ST = 124.8 kPa; and PT = 19.97 kPa; p < 0.0001) ([Fig. 10]).

Discussion
Studying the mechanical properties of tendons provides information about their function and disease prevention and treatment.[1] [3] [18] [26] [27] [29] In this context, the ST and PT are critical due to their wide use as grafts in surgeries for ligament reconstruction.[28]
The present study used tendons from fresh-frozen cadavers provided by the MH, not damaged by formaldehyde or ionizing radiation, enabling the evaluation of the stress x strain curve and computation of the relationship between the stress and the strain. The ST showed significantly higher resistance to strain under stress than the PT (p < 0.0001). We also observed a significant difference for the calculated E, showing a much higher value in the ST (ST = 124.8 Kpa; and PT = 19.97 Kpa; 0 < 0.0001). We compared μ values from the PT and ST obtained through ultrasound with SSI assessment at rest. Again, the ST was stiffer than the PT (ST = 124.3 ± 7.231 kPa; and PT = 58.86 ± 5.226 Kpa; p = 0.0059), showing agreement between the results obtained with SSI and those from the tensile tests. We also recorded the influence of tissue stress on the SSI assessment, showing that the greater the stress applied, the greater the μ recorded in both tendons, with a very strong correlation between the parameters (PT: R = 0.9507; p < 0.0001; and ST: R = 0.9528; p < 0.0001).
In the last decades the relevance of the SSI in real-time in-vivo tendon evaluation has been demonstrated.[7] [18] [19] [20] [26] [27] [29] A series of studies[19] [29] [30] have drawn attention to the importance of standardizing image acquisition, especially regarding the position of the limb examined. In 2019, for the first time, a study[8] showed the intimate relationship between the μ recorded using SSI and the stress imposed on a non-formolized human tendon; however, this work used a single specimen, presenting a low level of evidence. In the present study, we repeated this testing with two types of tendons (PT and ST), using 12 samples, showing a very strong and statistically significant correlation between these two variables. This sheds new light on the use of tendon assessment with SSI. From this moment on, it becomes critical to control the muscular action over the tendon studied, as this can significantly affect the elastographic record.
The current literature[9] [12] consistently demonstrates the relationship between E and μ, although not respecting the classic mathematical estimate. Recently, in 2023, Brandão et al.[25] studied 5 PTs and 11 calcaneus tendons from fresh-frozen human cadavers, finding a strong correlation between the variation in μ recorded by SSI with the E calculated by the stress x strain curve in the biomechanical test. In the present study, stiffness was higher in the ST than in the PT, both in the SSI and the traction test, with statistical significance. This suggests that SSI can reliably measure the mechanical properties of tendons in a way comparable to the gold standard.
In the context of using the PT and ST as grafts for ligament reconstruction, it is interesting that these tendons not only present high RF but also elastic characteristics similar to those of the native ligament. Previous studies[5] [11] have revealed a statistically significant correlation between μ and RF in normal animal tendons. Likewise, a reduction in μ and RF has been described in diseased or chemically-damaged tendons.[11] [14] Therefore, SSI may be particularly useful in assessing tendons and decision-making for graft selection. However, none of these studies performed such tests on human tendons.
The findings of the present study are consistent with those of Fontenelle et al.[19] who, in 2018, reported that the in-vivo μ value of the ST was higher than that of the PT in relaxed and stressed states. This may suggest the choice of the ST when reconstructing a more rigid structure.
It is worth highlighting certain limitations of the present study. Although we obtained consistent E values by calculating the slope of the stress x strain curve,[19] the trendons were not brought to failure. The tests were interrupted when the SSI reached saturation, and the region of elastic strain of the tendon may not have been reached, which would compromise the E estimate. Furthermore, despite all care, tendon fixation to the metal claws of the traction machine was particularly difficult when there was no bone plug. This difficulty can generate micromovements at the tendon-claw interface, underestimating the deformation record obtained. Future studies must consider this.
Finally, the most appropriate graft depends on the mechanical behavior not only of the tendon, but also of the ligaments for replacement. Future research in this field should pay particular attention to the biomechanical analysis of these ligaments.
Conclusion
The ST was stiffer than the PT both in the traction test and SSI evaluation at rest and under stress, with μ values revealing a direct relationship with the stress imposed on the tendon during its assessment.
Conflito de Interesses
Os autores não têm conflito de interesses a declarar.
Work carried out at the Traumatology and Orthopedics Service, Hospital Universitário Clementino Fraga Filho, Universidade Federal do Rio de Janeiro, Rio de Janeiro, Brazil.
-
Referências
- 1 Uehara H, Itoigawa Y, Wada T. et al. Shear wave elastography correlates to degeneration and stiffness of the long head of the biceps tendon in patients undergoing tenodesis with arthroscopic shoulder surgery. J Shoulder Elbow Surg 2024; 33 (01) e31-e41
- 2 Woo SL, Orlando CA, Camp JF, Akeson WH. Effects of postmortem storage by freezing on ligament tensile behavior. J Biomech 1986; 19 (05) 399-404
- 3 Mert A, Cinaroglu S, Keleş H, Aydin M, Çiçek F. Evaluation of Autografts Used in Anterior Cruciate Ligament Reconstruction in Terms of Tensile Strength. Cureus 2023; 15 (06) e39927
- 4 Nagelli CV, Hooke A, Quirk N. et al. Mechanical and strain behaviour of human Achilles tendon during in vitro testing to failure. Eur Cell Mater 2022; 43: 153-161
- 5 LaCroix AS, Duenwald-Kuehl SE, Lakes RS, Vanderby Jr R. Relationship between tendon stiffness and failure: a metaanalysis. J Appl Physiol 2013; 115 (01) 43-51
- 6 Götschi T, Schärer Y, Gennisson JL, Snedeker JG. Investigation of the relationship between tensile viscoelasticity and unloaded ultrasound shear wave measurements in ex vivo tendon. J Biomech 2023; 146: 111411
- 7 Mannarino P, Lima KMM, Fontenelle CRC. et al. Analysis of the correlation between knee extension torque and patellar tendon elastic property. Clin Physiol Funct Imaging 2018; 38 (03) 378-383
- 8 Ahmadzadeh SMH, Chen X, Hagemann H, Tang MX, Bull AMJ. Developing and using fast shear wave elastography to quantify physiologically-relevant tendon forces. Med Eng Phys 2019; 69: 116-122
- 9 Zhang ZJ, Fu SN. Shear Elastic Modulus on Patellar Tendon Captured from Supersonic Shear Imaging: Correlation with Tangent Traction Modulus Computed from Material Testing System and Test-Retest Reliability. PLoS One 2013; 8 (06) e68216
- 10 Bachmann E, Rosskopf AB, Götschi T. et al. T1- and T2*-Mapping for Assessment of Tendon Tissue Biophysical Properties: A Phantom MRI Study. Invest Radiol 2019; 54 (04) 212-220
- 11 Martin JA, Biedrzycki AH, Lee KS. et al. In Vivo Measures of Shear Wave Speed as a Predictor of Tendon Elasticity and Strength. Ultrasound Med Biol 2015; 41 (10) 2722-2730
- 12 Rosskopf AB, Bachmann E, Snedeker JG, Pfirrmann CWA, Buck FM. Comparison of shear wave velocity measurements assessed with two different ultrasound systems in an ex-vivo tendon strain phantom. Skeletal Radiol 2016; 45 (11) 1541-1551
- 13 Seynnes OR, Kamandulis S, Kairaitis R. et al. Effect of androgenic-anabolic steroids and heavy strength training on patellar tendon morphological and mechanical properties. J Appl Physiol 2013; 115 (01) 84-89
- 14 Yeh CL, Kuo PL, Gennisson JL, Brum J, Tanter M, Li PC. Shear Wave Measurements for Evaluation of Tendon Diseases. IEEE Trans Ultrason Ferroelectr Freq Control 2016; 63 (11) 1906-1921
- 15 Hohmann E, Keough N, Glatt V, Tetsworth K, Putz R, Imhoff A. The mechanical properties of fresh versus fresh/frozen and preserved (Thiel and Formalin) long head of biceps tendons: A cadaveric investigation. Ann Anat 2019; 221: 186-191
- 16 Dickson DM, Fawole HO, Newcombe L, Smith SL, Hendry GJ. Reliability of ultrasound strain elastography in the assessment of the quadriceps and patellar tendon in healthy adults. Ultrasound 2019; 27 (04) 252-261
- 17 Taljanovic MS, Gimber LH, Becker GW. et al. Shear-Wave Elastography: Basic Physics and Musculoskeletal Applications. Radiographics 2017; 37 (03) 855-870
- 18 Fontenelle CRDC, Schiefer M, Mannarino P. et al. Elastographic analysis of the supraspinatus tendon in different age groups. Acta Ortop Bras 2020; 28 (04) 190-194
- 19 Fontenelle CRC, Mannarino P, Ribeiro FBDO. et al. Semitendinosus and patellar tendons shear modulus evaluation by supersonic shearwave imaging elastography. Clin Physiol Funct Imaging 2018; 38 (06) 959-964
- 20 Lin DJ, Burke CJ, Abiri B, Babb JS, Adler RS. Supraspinatus muscle shear wave elastography (SWE): detection of biomechanical differences with varying tendon quality prior to gray-scale morphologic changes. Skeletal Radiol 2020; 49 (05) 731-738
- 21 Lima KMME, Costa Júnior JFS, Pereira WCA, Oliveira LF. Assessment of the mechanical properties of the muscle-tendon unit by supersonic shear wave imaging elastography: a review. Ultrasonography 2018; 37 (01) 3-15
- 22 Barr RG, Nakashima K, Amy D. et al. WFUMB guidelines and recommendations for clinical use of ultrasound elastography: Part 2: breast. Ultrasound Med Biol 2015; 41 (05) 1148-1160
- 23 Ferraioli G, Filice C, Castera L. et al. WFUMB guidelines and recommendations for clinical use of ultrasound elastography: Part 3: liver. Ultrasound Med Biol 2015; 41 (05) 1161-1179
- 24 Cosgrove D, Barr R, Bojunga J. et al. WFUMB Guidelines and Recommendations on the Clinical Use of Ultrasound Elastography: Part 4. Thyroid. Ultrasound Med Biol 2017; 43 (01) 4-26
- 25 Clara A Brandão M, Teixeira GC, Rubens C Fontenelle C, Fontenelle A, Oliveira LF, Menegaldo LL. Correlation between the shear modulus measured by elastography (SSI) and tangent modulus from tensile tests of in vitro fresh-frozen human tendons. J Biomech 2023; 160: 111826 [published online ahead of print, 2023 Oct 5]
- 26 Mifsud T, Chatzistergos P, Maganaris C. et al. Supersonic shear wave elastography of human tendons is associated with in vivo tendon stiffness over small strains. J Biomech 2023; 152: 111558
- 27 Akazawa T, Miyamoto N, Nishio H. et al. Age-related changes in mechanical properties of semitendinosus tendon used for anterior cruciate ligament reconstruction. J Orthop Surg Res 2022; 17 (01) 501
- 28 Widner M, Dunleavy M, Lynch S. Outcomes Following ACL Reconstruction Based on Graft Type: Are all Grafts Equivalent?. Curr Rev Musculoskelet Med 2019; 12 (04) 460-465
- 29 Mannarino P, Matta TTD, Oliveira LF. An 8-week resistance training protocol is effective in adapting quadriceps but not patellar tendon shear modulus measured by Shear Wave Elastography. PLoS One 2019; 14 (04) e0205782
- 30 Berko NS, Mehta AK, Levin TL, Schulz JF. Effect of knee position on the ultrasound elastography appearance of the patellar tendon. Clin Radiol 2015; 70 (10) 1083-1086
Endereço para correspondência
Publication History
Received: 20 November 2023
Accepted: 18 March 2024
Article published online:
04 September 2024
© 2024. The Author(s). This is an open access article published by Thieme under the terms of the Creative Commons Attribution 4.0 International License, permitting copying and reproduction so long as the original work is given appropriate credit (https://creativecommons.org/licenses/by/4.0/)
Thieme Revinter Publicações Ltda.
Rua do Matoso 170, Rio de Janeiro, RJ, CEP 20270-135, Brazil
-
Referências
- 1 Uehara H, Itoigawa Y, Wada T. et al. Shear wave elastography correlates to degeneration and stiffness of the long head of the biceps tendon in patients undergoing tenodesis with arthroscopic shoulder surgery. J Shoulder Elbow Surg 2024; 33 (01) e31-e41
- 2 Woo SL, Orlando CA, Camp JF, Akeson WH. Effects of postmortem storage by freezing on ligament tensile behavior. J Biomech 1986; 19 (05) 399-404
- 3 Mert A, Cinaroglu S, Keleş H, Aydin M, Çiçek F. Evaluation of Autografts Used in Anterior Cruciate Ligament Reconstruction in Terms of Tensile Strength. Cureus 2023; 15 (06) e39927
- 4 Nagelli CV, Hooke A, Quirk N. et al. Mechanical and strain behaviour of human Achilles tendon during in vitro testing to failure. Eur Cell Mater 2022; 43: 153-161
- 5 LaCroix AS, Duenwald-Kuehl SE, Lakes RS, Vanderby Jr R. Relationship between tendon stiffness and failure: a metaanalysis. J Appl Physiol 2013; 115 (01) 43-51
- 6 Götschi T, Schärer Y, Gennisson JL, Snedeker JG. Investigation of the relationship between tensile viscoelasticity and unloaded ultrasound shear wave measurements in ex vivo tendon. J Biomech 2023; 146: 111411
- 7 Mannarino P, Lima KMM, Fontenelle CRC. et al. Analysis of the correlation between knee extension torque and patellar tendon elastic property. Clin Physiol Funct Imaging 2018; 38 (03) 378-383
- 8 Ahmadzadeh SMH, Chen X, Hagemann H, Tang MX, Bull AMJ. Developing and using fast shear wave elastography to quantify physiologically-relevant tendon forces. Med Eng Phys 2019; 69: 116-122
- 9 Zhang ZJ, Fu SN. Shear Elastic Modulus on Patellar Tendon Captured from Supersonic Shear Imaging: Correlation with Tangent Traction Modulus Computed from Material Testing System and Test-Retest Reliability. PLoS One 2013; 8 (06) e68216
- 10 Bachmann E, Rosskopf AB, Götschi T. et al. T1- and T2*-Mapping for Assessment of Tendon Tissue Biophysical Properties: A Phantom MRI Study. Invest Radiol 2019; 54 (04) 212-220
- 11 Martin JA, Biedrzycki AH, Lee KS. et al. In Vivo Measures of Shear Wave Speed as a Predictor of Tendon Elasticity and Strength. Ultrasound Med Biol 2015; 41 (10) 2722-2730
- 12 Rosskopf AB, Bachmann E, Snedeker JG, Pfirrmann CWA, Buck FM. Comparison of shear wave velocity measurements assessed with two different ultrasound systems in an ex-vivo tendon strain phantom. Skeletal Radiol 2016; 45 (11) 1541-1551
- 13 Seynnes OR, Kamandulis S, Kairaitis R. et al. Effect of androgenic-anabolic steroids and heavy strength training on patellar tendon morphological and mechanical properties. J Appl Physiol 2013; 115 (01) 84-89
- 14 Yeh CL, Kuo PL, Gennisson JL, Brum J, Tanter M, Li PC. Shear Wave Measurements for Evaluation of Tendon Diseases. IEEE Trans Ultrason Ferroelectr Freq Control 2016; 63 (11) 1906-1921
- 15 Hohmann E, Keough N, Glatt V, Tetsworth K, Putz R, Imhoff A. The mechanical properties of fresh versus fresh/frozen and preserved (Thiel and Formalin) long head of biceps tendons: A cadaveric investigation. Ann Anat 2019; 221: 186-191
- 16 Dickson DM, Fawole HO, Newcombe L, Smith SL, Hendry GJ. Reliability of ultrasound strain elastography in the assessment of the quadriceps and patellar tendon in healthy adults. Ultrasound 2019; 27 (04) 252-261
- 17 Taljanovic MS, Gimber LH, Becker GW. et al. Shear-Wave Elastography: Basic Physics and Musculoskeletal Applications. Radiographics 2017; 37 (03) 855-870
- 18 Fontenelle CRDC, Schiefer M, Mannarino P. et al. Elastographic analysis of the supraspinatus tendon in different age groups. Acta Ortop Bras 2020; 28 (04) 190-194
- 19 Fontenelle CRC, Mannarino P, Ribeiro FBDO. et al. Semitendinosus and patellar tendons shear modulus evaluation by supersonic shearwave imaging elastography. Clin Physiol Funct Imaging 2018; 38 (06) 959-964
- 20 Lin DJ, Burke CJ, Abiri B, Babb JS, Adler RS. Supraspinatus muscle shear wave elastography (SWE): detection of biomechanical differences with varying tendon quality prior to gray-scale morphologic changes. Skeletal Radiol 2020; 49 (05) 731-738
- 21 Lima KMME, Costa Júnior JFS, Pereira WCA, Oliveira LF. Assessment of the mechanical properties of the muscle-tendon unit by supersonic shear wave imaging elastography: a review. Ultrasonography 2018; 37 (01) 3-15
- 22 Barr RG, Nakashima K, Amy D. et al. WFUMB guidelines and recommendations for clinical use of ultrasound elastography: Part 2: breast. Ultrasound Med Biol 2015; 41 (05) 1148-1160
- 23 Ferraioli G, Filice C, Castera L. et al. WFUMB guidelines and recommendations for clinical use of ultrasound elastography: Part 3: liver. Ultrasound Med Biol 2015; 41 (05) 1161-1179
- 24 Cosgrove D, Barr R, Bojunga J. et al. WFUMB Guidelines and Recommendations on the Clinical Use of Ultrasound Elastography: Part 4. Thyroid. Ultrasound Med Biol 2017; 43 (01) 4-26
- 25 Clara A Brandão M, Teixeira GC, Rubens C Fontenelle C, Fontenelle A, Oliveira LF, Menegaldo LL. Correlation between the shear modulus measured by elastography (SSI) and tangent modulus from tensile tests of in vitro fresh-frozen human tendons. J Biomech 2023; 160: 111826 [published online ahead of print, 2023 Oct 5]
- 26 Mifsud T, Chatzistergos P, Maganaris C. et al. Supersonic shear wave elastography of human tendons is associated with in vivo tendon stiffness over small strains. J Biomech 2023; 152: 111558
- 27 Akazawa T, Miyamoto N, Nishio H. et al. Age-related changes in mechanical properties of semitendinosus tendon used for anterior cruciate ligament reconstruction. J Orthop Surg Res 2022; 17 (01) 501
- 28 Widner M, Dunleavy M, Lynch S. Outcomes Following ACL Reconstruction Based on Graft Type: Are all Grafts Equivalent?. Curr Rev Musculoskelet Med 2019; 12 (04) 460-465
- 29 Mannarino P, Matta TTD, Oliveira LF. An 8-week resistance training protocol is effective in adapting quadriceps but not patellar tendon shear modulus measured by Shear Wave Elastography. PLoS One 2019; 14 (04) e0205782
- 30 Berko NS, Mehta AK, Levin TL, Schulz JF. Effect of knee position on the ultrasound elastography appearance of the patellar tendon. Clin Radiol 2015; 70 (10) 1083-1086