

Subscribe to RSS
DOI: 10.1055/s-0043-1776287
High Fluorescent Cells on Automated Body Fluid Analysis as Discriminator for Malignant Cell Detection
Authors

Abstract
The automated examination of body fluids (BF) serves as a valuable screening tool for the presence of malignant cells in such samples. Malignant cells are identified as high fluorescence cells (HFC) when analyzed using the Sysmex XN-1000 automated analyzer. This study aimed to assess the correlation between HFC cell counts generated by the automated analyzer and manual cytological examination for detecting malignant cells. Additionally, it sought to establish reliable cutoff values for malignant cells since there is a lack of literature on this subject. Conducted at the department of pathology hematology and cytology laboratory in a tertiary care hospital in India from January 2019 to May 2020, this hospital-based comparative study analyzed 120 BF samples, each subjected to cytological evaluation. The mean age of the study population was 52 years, with 70 male and 50 female patients (male-to-female ratio of 1.4:1). The samples consisted of 53 ascitic fluids (44.17%), 46 pleural fluids (38.33%), and 21 cerebrospinal fluids (CSF; 17.50%). Cytopathological examination revealed malignant cells in 50 (41.67%) of the BF samples, with 70 (58.33%) samples classified as nonmalignant. Specifically, among the ascitic fluids, 24 (48%) were malignant, while 29 (41.43%) were nonmalignant. For pleural fluids, 24 (48%) were malignant, and 22 (31.43%) were nonmalignant. In CSF, 2 (4%) samples were malignant, and 19 (27.14%) were nonmalignant. The total white blood cell counts provided by automated hematology analyzers were significantly higher in malignant samples, ranging from a minimum of 100 cells to a maximum of 60,000, with a median count of 800. Nonmalignant samples had white blood cell counts ranging from 2 to 12,000, with a median count of 100. Subgroup analysis for ascitic, pleural, and CSF samples revealed significantly higher median HFC counts in malignant samples. Receiver operating characteristic curve analysis indicated that the HF-BF parameter could effectively distinguish between benign and malignant fluids. For HF#, the area under the curve (AUC) was 0.844, with a sensitivity of 82% and specificity of 81%, while HF% had an AUC of 0.706, with sensitivity and specificity values of 72% and 72.9%, respectively. This study highlights that the HFC count in the BF mode of Sysmex XN-1000 can be a valuable tool for predicting the presence of malignant cells in serous fluids and for selecting samples for further microscopic examination. Based on this study, cutoff values of 15.70/µL for absolute HFC count and 5.05% for relative HFC count can be applied to screen BF samples for malignancy, offering good sensitivity and specificity.
Keywords
automation - body fluid - high fluorescent cells - malignant cells screening - Sysmex XN-1000Introduction
The analysis of body fluids (BF)—pleural, ascitic, cerebrospinal fluid (CSF)—is an important diagnostic modality that gives evidence of malignancy[1] [2] and therefore it has vital role in the management of cancer patients. The gold standard of BF examination is manual hemocytometer followed by cytomorphological examinations of BF with Papanicolaou[3] and other stain like hematoxylin and eosin. The manual methods have high turnaround time and large interobserver variability; therefore, automated BF analysis is useful as it enables laboratories to cut short the turnaround time affording rapid diagnostic information to clinicians.[4] [5] [6] The BF module on the XN-1000 (Sysmex Corporation) represents a convenient platform for accurate and fast quantification of total nucleated cells.[7] The BF mode (Sysmex-1000) differentiates cells as neutrophils and eosinophils, lymphocytes, and monocytes. This channel records high fluorescence body fluid (HF-BF) cells, which are not included in the white blood cell (WBC) count, but are included in the total nucleated cell count.[4] HFCs have higher fluorescence signal because of large amount of nucleic acids. The HF-BF cells are segregated by their differential fluorescence intensity, and they include malignant cell, mesothelioma cells, and macrophages.
The cutoff percentage of HF cells is not defined in literature, and it therefore is a limitation in the use of hematology (XN-1000) as a screening tool. This study was aimed to reliably estimate the cutoff for HF cells. More such studies are needed to validate the findings of this study.
Materials and Methods
A descriptive type of observational (validation) cross-sectional study was conducted over a period of 1 year, extending from January 2019 to May 2020, in the department of pathology in a tertiary care hospital in west India. This study group comprised of patients who submitted BFs sample such as CSF, pleural fluid, and ascitic fluid to the laboratory for examination for malignant cells. This study was approved by institutional ethics committee and subjects were included in study after written informed consent was obtained from the participants.
The following exclusion criteria were applied:
-
Cases with inadequate quantity of sample for both manual count and automated analysis
-
Samples were excluded if more than 10% degenerated cells were identified in the counting chamber
-
If WBC count using the manual method was less than 5 cells/µL in non-CSF samples.
A total of 120 specimens of BFs, including 53 (44.17%) ascitic fluid, 46 (38.3%) pleural fluid, and 21 (17.50%) CSF, were analyzed on BF mode on Sysmex XN-1000 (Sysmex, Kobe, Japan). Sample collection, preservation, transport, and analysis were performed in accordance with the Clinical & Laboratory Standards Institute (CLSI) H56-A guideline.[7] The cell identification was done by both manual and automated methods. All fluid samples were collected in K2-ethylenediaminetetraacetic acid anticoagulants tubes or sterile recipients without anticoagulant. Sample were received by laboratory immediately after collection and automated analysis and slide preparation was completed within 2 hours. Cytology section received separate sample and manual microscopy was done on slide stained by special stains.
The samples were first run in the BF mode in XN-1000automated hematology analyzer. Manual microscopic counting was performed using a Neubauer hemocytometer using samples diluted 1:10 (50 μL CSF + 450 μL of solution) in Turk's solution (crystal violet and glacial acetic acid dissolved in distilled water). Cell counting was performed at 200× magnification using a standard light microscope. The average number was converted into cells/ μL according to the following formula provided in the CLSI H56-A guidelines.[7] The differential WBC counts were performed after sample cytocentrifugation (7 minutes at 1250 rpm) and later smear preparation stained with Wright staining. At least 100 cells were counted at 400× magnification.
The results of automated XN 1000 analyzer were compared with manual method for BF examination. The statistical analysis was done using online free statistical calculator (Medicals).
Results
This study comprised of 160 samples of BF received in the department of pathology between January 2019 and May 2020. The majority of samples were from the age group 41 to 50 years (20.83%) followed by 51 to 60 years (20.0 %). The mean age group for this study population was 52.48 years ([Fig. 1]). Out of 120 patients, 70 patients were male and 50 were female with male female ratio of 1.4:1 ([Fig. 2]).


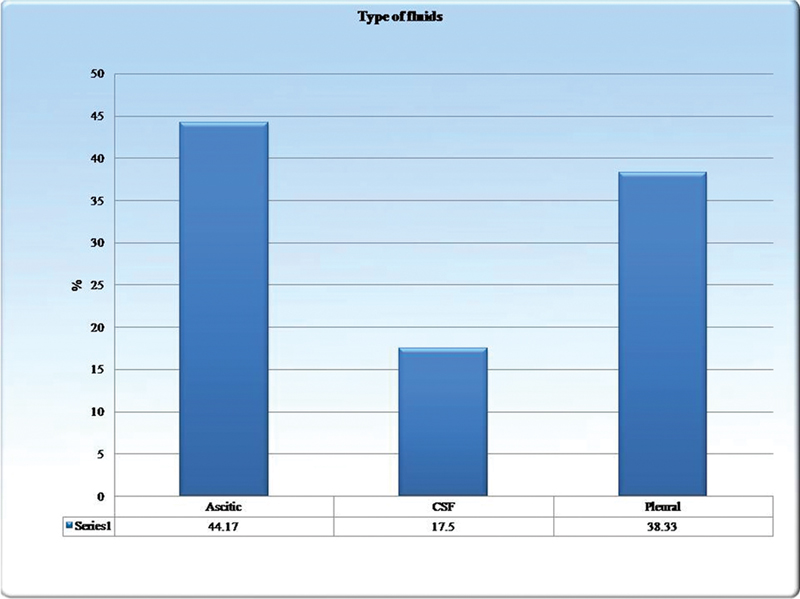
There were three types of BF samples: 53 ascitic fluid (44.17 %), 46 pleural fluid (38.33%), and 21 CSF (17.50%; [Fig. 3]). Fifty (41.67%) fluids had malignant cells on cytopathological examination ([Fig. 4]).

Of the 53 ascitic fluids, 24 (45.3%) samples were reported as malignant, and 29 (54.7%) samples were reported as nonmalignant cells. Out of 46 pleural fluids, 24 (52.2%) samples were reported as malignant and 22 (47.8%) as nonmalignant. For 21 CSF only, 2 (9.5%) were reported as malignant and 19 (70.5%) CSF as nonmalignant ([Fig. 5]). Mean value of total WBC count for malignant sample was higher than nonmalignant samples (statistically nonsignificant as p-value more than 0.05; [Table 1]).

Abbreviations: TLC, total leucocyte count; SD, standard deviation; WBC, white blood cell
In our study, the mean polymorphonuclear cells (PMN)% for malignant and nonmalignant samples were 34.80 and 36.03%, respectively, with p-value 0.78. There is no significant correlation found in between PMN% and malignant status of fluid (statistically in significant, p-value 0.96; [Table 2]).
Abbreviations: PMN, polymorphonuclear cells; SD, standard deviation.
In this study, mean mononuclear cells (MN)% for malignant and nonmalignant samples were 58.40 and 62.57%, respectively. MN% was slightly higher in nonmalignant sample in our study; however, the results (statistically in significant, p-value >.05; [Table 3]). [Table 4] shows mean WBC count for malignant and nonmalignant BFs—ascetic, pleural, and CSF.
Abbreviations: MN, mononuclear cells; SD, standard deviation.
Abbreviations: CSF, cerebrospinal fluid; SD, standard deviation; WBC, white blood cell.
The mean WBC count for malignant fluid was 995.83 and for nonmalignant fluid it was 254.48. For pleural fluid, mean WBC count for malignant fluids was 3433.33 and for nonmalignant fluids, it was 802.27. Similarly, for CSF mean count was 645 and 21.16 for malignant and nonmalignant fluids, respectively ([Table 4]).
The mean absolute HFC count for malignant fluids was 450 and 16.40/µL for nonmalignant fluids in all BFs. For ascitic fluid, mean HFC count for malignant/nonmalignant cell was 458.05 and 12.37/µL, for pleural fluid mean HFC count for malignant/nonmalignant cell was 467.58 and 29.49/µL, and for CSF it was 164.50 and 7.41/ µL, respectively ([Table 5]).
Abbreviations: CSF, cerebrospinal fluid; HFC, high fluorescence cell; SD, standard deviation.
Mean absolute HF% for all malignant fluids was 21.1 and 9.9% for nonmalignant fluids. Mean HF% for ascitic fluid was 18.6 and 7.0% for malignant and nonmalignant fluids, respectively.
Mean HF% for pleural fluid was 20.7 and 16.9% for malignant and nonmalignant fluids, respectively. Mean HF% for CSF was 55.4 and 6.1% for malignant and nonmalignant sample, respectively ([Table 6]).
Abbreviations: CSF, cerebrospinal fluid; HFC, high fluorescence cell; SD, standard deviation.
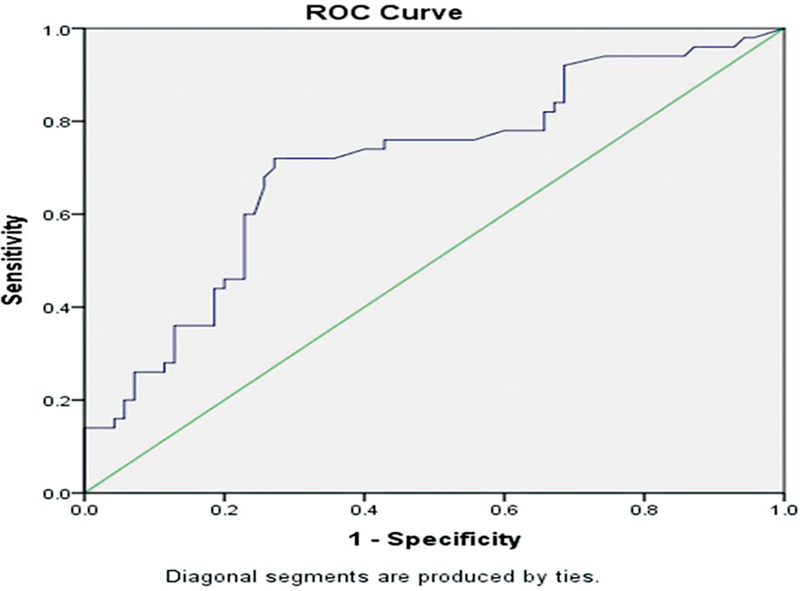
The receiver operating characteristic (ROC) curve analysis was performed to determine the optimal cutoff values of significant variables (Hf#) detected between the two groups ROC for Hf# showing (1-specificty) on the X axis and sensitivity on Y Axis exercise different cut off value to provide the greatest sum of sensitivity and specificity ([Fig. 6]).

The optimum cutoff value was obtained by points of test values that grants the highest Youden Index comes out to be 15.70% with a sensitivity of 82% and a specificity of 81% ([Table 7]). Similarly, for HF%, the optimal cutoff was 5.05%. The sensitivity and specificity of 72% were determined with SE 0.039 ([Table 8]; [Fig. 7]).
|
Area under the curve |
||||
|---|---|---|---|---|
|
Test result variable(s): HF# |
||||
|
Area |
SE[a] |
Asymptotic sig.[b] |
Asymptotic 95% confidence interval |
|
|
Lower bound |
Upper bound |
|||
|
0.844 |
0.040 |
0.000 |
0.766 |
0.922 |
|
Positive if greater than or equal To[a] |
Sensitivity |
1-Specificity |
Specificity |
Y |
|
15.700 |
0.820 |
0.188 |
0.812 |
0.632 |
Abbreviations: HFC, high fluorescence cell; ROC, receiver operating characteristic; SE, standard error.
The test result variable(s): HF# has at least one tie between the positive actual state group and the negative actual state group. Statistics may be biased.
a Under the nonparametric assumption.
b Null hypothesis: true area = 0.5.
|
Test result variable(s): HF% |
||||
|---|---|---|---|---|
|
Area |
SE[a] |
Asymptotic sig.[b] |
Asymptotic 95% confidence interval |
|
|
Lower bound |
Upper bound |
|||
|
0.706 |
0.049 |
0.000 |
0.610 |
0.802 |
|
Positive if greater than or equal To[a] |
Sensitivity |
1-Specificity |
Specificity |
Y |
|
5.050 |
0.720 |
0.271 |
0.729 |
0.449 |
Abbreviations: HFC, high fluorescence cell; ROC, receiver operating characteristic; SE, standard error.
The test result variable(s): HF% has at least one tie between the positive actual state group and the negative actual state group. Statistics may be biased.
a Under the nonparametric assumption.
b Null hypothesis: true area = 0.5.
Discussion
The past two decades have seen rapid advancement in automation in the field of laboratory medicine, from high output automatic analyzers to the use of machine learning algorithms of artificial intelligence.[8] [9] [10] [11] [12] [13] [14] [15] [16] [17] The scarcity of trained manpower, need for rapid turnaround time, and minimal subjective bias are some of the factors that have driven manufacturers to bring new equipment for automated analysis. This study included three types of BFs similar to studies by Rastogi et al[18] and Cho et al[19] for performance evaluation of automated BF analyzer using HF-BF parameters as discriminators, whereas others like Wu et al,[20] Wrong et al,[21] and Zimmerman et al[22] used single type of BF for analysis ([Figs. 8],[9],[10]).


The total WBC count in this study was higher for malignant BFs than nonmalignant ones. The finding is similar to studies by Huang et al,[23] Xu et al,[24] Labaere et al,[25] and Sun et al.[26]
As per ROC analysis, the HF% cutoff of 5.5% equivalent to HF cell count of 15.70/µL should yield good sensitivity and specificity for malignant cell detection in this study that could be used as discriminator. The comparison with other literature studies is shown in [Table 9]. The findings of the study are in line with those by Rastogi et al,[18] Buoro et al,[27] Huang et al,[23] Xu et al,[24] and Larruzia et al[28] had higher cutoff value determination than this study. The use of automated analyzer is mainly as a screening tool, whereas the cytological examination remains the gold standard. The cutoff selected in this study is justified as the automated analysis being used as screening tool should not compromise on sensitivity. The results are comparable to studies by Labaere et al,[25] Cho et al,[19] and Zimmerman et al[22] who found false positive similar to this study—11 malignant cases out of 70 nonmalignant cases. They also reported interference by histiocytes, mesothelial cells, and plasma cells. In terms of false negatives, there were 7 out of 50 cases; majority of them were CSF samples that have low cell yield. There was no carry over of WBC in this study as reported by Caroline et al.[9] The advantage of automated BF analyzer could not be undermined as the analysis is quick and reliable as stressed by Caroline et al[29] and Aguadero et al.[30]
|
Sl no. |
Study name |
HF-BF# |
AUC |
95% CI |
Sensitivity |
Specificities |
|---|---|---|---|---|---|---|
|
1. |
Rastogi et al[18] |
> 12 |
0.76 |
0.690–0.830 |
71.2 |
71.2 |
|
2. |
Huang et al[23] |
39 |
0.67 |
0.56–0.78 |
74 |
62 |
|
3. |
Wu et al[20] |
29.5 |
0.66 |
0.569–0.743 |
70.4 |
61.8 |
|
4 |
Xu et al[24] |
24.5 |
0.708 |
0.635–0.780 |
75.3 |
55 |
|
5. |
Labaere et al[23] |
17 |
0.77 |
0.69–0.84 |
88 |
61 |
|
6. |
Buoro et al[27] |
50 |
0.75 |
0.61–0.79 |
49 |
90 |
|
7. |
Present study |
15.700 |
.84 |
0.766–0.922 |
82 |
81 |
Abbreviations: AUC, area under the curve; CI, confidence interval; HF-BF, high fluorescence body fluid.
We acknowledge that the limited sample size and inability to capture time interval between sample collection and analysis were limitations of the study. It mandates that in the absence of clear-cut discriminatory value for HF cells to detect malignant cells, each laboratory should establish its own cutoff in BF analysis on automated analyzer.
Conclusion
Automated BF analysis using Sysmex XN-1000[31] could be a sensitive tool in predicting the nature of BF offering quick screening as adjuvant to routine cytological examination.
Conflict of Interest
None declared.
-
References
- 1 Block DR, Algeciras-Schimnich A. Body fluid analysis: clinical utility and applicability of published studies to guide interpretation of today's laboratory testing in serous fluids. Crit Rev Clin Lab Sci 2013; 50 (4-5): 107-124
- 2 McPherson RA, Bidkorpeh EK, Castellani WJ. et al. Analysis of Body Fluids in clinical Chemistry; Approved Guideline. 2nd ed.. Wayne, PA: Clinical and Laboratory Standards Institute; 2016
- 3 Chantziantoniou N, Donnelly AD, Mukherjee M, Boon ME, Austin RM. Inception and development of the Papanicolaou stain method. Acta Cytol 2017; 61 (4-5): 266-280
- 4 Fleming C, Brouwer R, Lindemans J, de Jonge R. Validation of the body fluid module on the new Sysmex XN-1000 for counting blood cells in cerebrospinal fluid and other body fluids. Clin Chem Lab Med 2012; 50 (10) 1791-1798
- 5 Zimmermann M, Ruprecht K, Kainzinger F, Heppner FL, Weimann A. Automated vs. manual cerebrospinal fluid cell counts: a work and cost analysis comparing the Sysmex XE-5000 and the Fuchs-Rosenthal manual counting chamber. Int J Lab Hematol 2011; 33 (06) 629-637
- 6 Ai T, Tabe Y, Takemura H. et al. Novel flowcytometry-based approach of malignant cell detection in body fluids using an automated hematology analyzer. PLoS One 2018; 13 (02) e0190886
- 7 Clinical and Laboratory Standards Institution (CLSI). Body Fluid Analysis for Cellular Composition. Approved Guideline CLSI Document H56-A. Waye, PA: CLSI; 2006
- 8 Park JY, Kricka LJ. One hundred years of clinical laboratory automation: 1967-2067. Clin Biochem 2017; 50 (12) 639-644
- 9 Yang T, Wang TK, Li VC, Su CL. The optimization of total laboratory automation by simulation of a pull-strategy. J Med Syst 2015; 39 (01) 162
- 10 Shen JX. Regulated bioanalytical laboratory automation: where we came from, where we are and where we are going. Bioanalysis 2011; 3 (13) 1415-1418
- 11 Siano GG, Montemurro M, Alcaráz MR, Goicoechea HC. Open-source assisted laboratory automation through graphical user interfaces and 3D printers: application to equipment hyphenation for higher-order data generation. Anal Chem 2017; 89 (20) 10667-10672
- 12 Sin ML, Gau V, Liao JC, Wong PK. Electrothermal fluid manipulation of high-conductivity samples for laboratory automation applications. J Assoc Lab Autom 2010; 15 (06) 426-432
- 13 Theparee T, Das S, Thomson Jr RB. Total laboratory automation and matrix-assisted laser desorption ionization-time of flight mass spectrometry improve turnaround times in the clinical microbiology laboratory: a retrospective analysis. J Clin Microbiol 2017; 56 (01) e01242-e17
- 14 Johnson JL, Tom Wörden H, van Wijk K. PLACE: an open-source python package for laboratory automation, control, and experimentation. J Lab Autom 2015; 20 (01) 10-16
- 15 Ialongo C, Pieri M, Bernardini S. Artificial neural net- work for total laboratory automation to improve the management of sample dilution. SLAS Technol 2017; 22 (01) 44-49
- 16 Genzen JR, Burnham CD, Felder RA, Hawker CD, Lippi G, Peck Palmer OM. Challenges and opportunities in implementing total laboratory automation. Clin Chem 2018; 64 (02) 259-264
- 17 Delaney NF, Rojas Echenique JI, Marx CJ. Clarity: an open-source manager for laboratory automation. J Lab Autom 2013; 18 (02) 171-177
- 18 Rastogi L, Dass J, Arya V, Kotwal J. Evaluation of high-fluorescence body fluid (HF-BF) parameter as a screening tool of malignancy in body fluids. Indian J Pathol Microbiol 2019; 62 (04) 572-577
- 19 Cho YU, Chi HS, Park SH, Jang S, Kim YJ, Park CJ. Body fluid cellular analysis using the Sysmex XN-2000 automatic hematology analyzer: focusing on malignant samples. Int J Lab Hematol 2015; 37 (03) 346-356
- 20 Wu W, Zhao C, Shen T, Tong X, Chen W. The diagnostic ability of high-fluorescent cells combined with carcinoembryonic antigen for malignant pleural effusion. Int J Lab Hematol 2019; 41 (04) 509-512
- 21 Wong-Arteta J, Merino A, Torrente S, Banales JM, Bujanda L. High fluorescence cell count in ascitic body fluids for carcinomatosis screening. Clin Chem Lab Med 2018; 56 (11) 272-274
- 22 Zimmermann M, Otto C, Gonzalez JB, Prokop S, Ruprecht K. Cellular origin and diagnostic significance of high-fluorescent cells in cerebrospinal fluid detected by the XE-5000 hematology analyzer. Int J Lab Hematol 2013; 35 (06) 580-588
- 23 Huang WH, Lu LP, Wu K. et al. Extent of agreement between the body fluid model of Sysmex XN-20 and the manual microscopy method. J Clin Lab Anal 2017; 31 (05) e22101
- 24 Xu W, Yu Q, Xie L, Chen B, Zhang L. Evaluation of Sysmex XN-1000 hematology analyzer for cell count and screening of malignant cells of serous cavity effusion. Medicine (Baltimore) 2017; 96 (27) e7433
- 25 Labaere D, Boeckx N, Geerts I, Moens M, Van den Driessche M. Detection of malignant cells in serous body fluids by counting high-fluorescent cells on the Sysmex XN-2000 hematology analyzer. Int J Lab Hematol 2015; 37 (05) 715-722
- 26 Sun J, Ding S, Zhu L. et al. Improving performance of recently introduced flow cytometry-based approach of malignant cell screening in serous cavity effusion. Int J Lab Hematol 2020; 42 (05) 612-618
- 27 Buoro S, Appassiti Esposito S, Vavassori M. et al. Reflex testing rules for cell count and differentiation of nucleated elements in pleural and ascitic fluids on Sysmex XE-5000. J Lab Autom 2016; 21 (02) 297-304
- 28 Larruzea A, Aguadero V, Orellana R, Berlanga E. High-fluorescent cells: a marker of malignancy in the analysis of body fluid samples. Int J Lab Hematol 2018; 40 (03) e43-e45
- 29 Caroline RR, Cognialli R, Comar SR, de Souza AM, Singer GM. Evaluation of pleural and ascitic fluid analysis on the sysmex XE-5000 hematology analyzer. J Dras Patol Med Lab 2017; 53: 150-158
- 30 Aguadero V, Cano-Corres R, Berlanga E, Torra M. Evaluation of biological fluid analysis using the sysmex XN automatic hematology analyzer. Cytometry B Clin Cytom 2018; 94 (05) 680-688
- 31 Nanos NE, Delanghe JR. Evaluation of Sysmex UF-1000i for use in cerebrospinal fluid analysis. Clin Chim Acta 2008; 392 (1-2): 30-33
Address for correspondence
Publication History
Article published online:
27 October 2023
© 2023. MedIntel Services Pvt Ltd. This is an open access article published by Thieme under the terms of the Creative Commons Attribution-NonDerivative-NonCommercial License, permitting copying and reproduction so long as the original work is given appropriate credit. Contents may not be used for commercial purposes, or adapted, remixed, transformed or built upon. (https://creativecommons.org/licenses/by-nc-nd/4.0/)
Thieme Medical and Scientific Publishers Pvt. Ltd.
A-12, 2nd Floor, Sector 2, Noida-201301 UP, India
-
References
- 1 Block DR, Algeciras-Schimnich A. Body fluid analysis: clinical utility and applicability of published studies to guide interpretation of today's laboratory testing in serous fluids. Crit Rev Clin Lab Sci 2013; 50 (4-5): 107-124
- 2 McPherson RA, Bidkorpeh EK, Castellani WJ. et al. Analysis of Body Fluids in clinical Chemistry; Approved Guideline. 2nd ed.. Wayne, PA: Clinical and Laboratory Standards Institute; 2016
- 3 Chantziantoniou N, Donnelly AD, Mukherjee M, Boon ME, Austin RM. Inception and development of the Papanicolaou stain method. Acta Cytol 2017; 61 (4-5): 266-280
- 4 Fleming C, Brouwer R, Lindemans J, de Jonge R. Validation of the body fluid module on the new Sysmex XN-1000 for counting blood cells in cerebrospinal fluid and other body fluids. Clin Chem Lab Med 2012; 50 (10) 1791-1798
- 5 Zimmermann M, Ruprecht K, Kainzinger F, Heppner FL, Weimann A. Automated vs. manual cerebrospinal fluid cell counts: a work and cost analysis comparing the Sysmex XE-5000 and the Fuchs-Rosenthal manual counting chamber. Int J Lab Hematol 2011; 33 (06) 629-637
- 6 Ai T, Tabe Y, Takemura H. et al. Novel flowcytometry-based approach of malignant cell detection in body fluids using an automated hematology analyzer. PLoS One 2018; 13 (02) e0190886
- 7 Clinical and Laboratory Standards Institution (CLSI). Body Fluid Analysis for Cellular Composition. Approved Guideline CLSI Document H56-A. Waye, PA: CLSI; 2006
- 8 Park JY, Kricka LJ. One hundred years of clinical laboratory automation: 1967-2067. Clin Biochem 2017; 50 (12) 639-644
- 9 Yang T, Wang TK, Li VC, Su CL. The optimization of total laboratory automation by simulation of a pull-strategy. J Med Syst 2015; 39 (01) 162
- 10 Shen JX. Regulated bioanalytical laboratory automation: where we came from, where we are and where we are going. Bioanalysis 2011; 3 (13) 1415-1418
- 11 Siano GG, Montemurro M, Alcaráz MR, Goicoechea HC. Open-source assisted laboratory automation through graphical user interfaces and 3D printers: application to equipment hyphenation for higher-order data generation. Anal Chem 2017; 89 (20) 10667-10672
- 12 Sin ML, Gau V, Liao JC, Wong PK. Electrothermal fluid manipulation of high-conductivity samples for laboratory automation applications. J Assoc Lab Autom 2010; 15 (06) 426-432
- 13 Theparee T, Das S, Thomson Jr RB. Total laboratory automation and matrix-assisted laser desorption ionization-time of flight mass spectrometry improve turnaround times in the clinical microbiology laboratory: a retrospective analysis. J Clin Microbiol 2017; 56 (01) e01242-e17
- 14 Johnson JL, Tom Wörden H, van Wijk K. PLACE: an open-source python package for laboratory automation, control, and experimentation. J Lab Autom 2015; 20 (01) 10-16
- 15 Ialongo C, Pieri M, Bernardini S. Artificial neural net- work for total laboratory automation to improve the management of sample dilution. SLAS Technol 2017; 22 (01) 44-49
- 16 Genzen JR, Burnham CD, Felder RA, Hawker CD, Lippi G, Peck Palmer OM. Challenges and opportunities in implementing total laboratory automation. Clin Chem 2018; 64 (02) 259-264
- 17 Delaney NF, Rojas Echenique JI, Marx CJ. Clarity: an open-source manager for laboratory automation. J Lab Autom 2013; 18 (02) 171-177
- 18 Rastogi L, Dass J, Arya V, Kotwal J. Evaluation of high-fluorescence body fluid (HF-BF) parameter as a screening tool of malignancy in body fluids. Indian J Pathol Microbiol 2019; 62 (04) 572-577
- 19 Cho YU, Chi HS, Park SH, Jang S, Kim YJ, Park CJ. Body fluid cellular analysis using the Sysmex XN-2000 automatic hematology analyzer: focusing on malignant samples. Int J Lab Hematol 2015; 37 (03) 346-356
- 20 Wu W, Zhao C, Shen T, Tong X, Chen W. The diagnostic ability of high-fluorescent cells combined with carcinoembryonic antigen for malignant pleural effusion. Int J Lab Hematol 2019; 41 (04) 509-512
- 21 Wong-Arteta J, Merino A, Torrente S, Banales JM, Bujanda L. High fluorescence cell count in ascitic body fluids for carcinomatosis screening. Clin Chem Lab Med 2018; 56 (11) 272-274
- 22 Zimmermann M, Otto C, Gonzalez JB, Prokop S, Ruprecht K. Cellular origin and diagnostic significance of high-fluorescent cells in cerebrospinal fluid detected by the XE-5000 hematology analyzer. Int J Lab Hematol 2013; 35 (06) 580-588
- 23 Huang WH, Lu LP, Wu K. et al. Extent of agreement between the body fluid model of Sysmex XN-20 and the manual microscopy method. J Clin Lab Anal 2017; 31 (05) e22101
- 24 Xu W, Yu Q, Xie L, Chen B, Zhang L. Evaluation of Sysmex XN-1000 hematology analyzer for cell count and screening of malignant cells of serous cavity effusion. Medicine (Baltimore) 2017; 96 (27) e7433
- 25 Labaere D, Boeckx N, Geerts I, Moens M, Van den Driessche M. Detection of malignant cells in serous body fluids by counting high-fluorescent cells on the Sysmex XN-2000 hematology analyzer. Int J Lab Hematol 2015; 37 (05) 715-722
- 26 Sun J, Ding S, Zhu L. et al. Improving performance of recently introduced flow cytometry-based approach of malignant cell screening in serous cavity effusion. Int J Lab Hematol 2020; 42 (05) 612-618
- 27 Buoro S, Appassiti Esposito S, Vavassori M. et al. Reflex testing rules for cell count and differentiation of nucleated elements in pleural and ascitic fluids on Sysmex XE-5000. J Lab Autom 2016; 21 (02) 297-304
- 28 Larruzea A, Aguadero V, Orellana R, Berlanga E. High-fluorescent cells: a marker of malignancy in the analysis of body fluid samples. Int J Lab Hematol 2018; 40 (03) e43-e45
- 29 Caroline RR, Cognialli R, Comar SR, de Souza AM, Singer GM. Evaluation of pleural and ascitic fluid analysis on the sysmex XE-5000 hematology analyzer. J Dras Patol Med Lab 2017; 53: 150-158
- 30 Aguadero V, Cano-Corres R, Berlanga E, Torra M. Evaluation of biological fluid analysis using the sysmex XN automatic hematology analyzer. Cytometry B Clin Cytom 2018; 94 (05) 680-688
- 31 Nanos NE, Delanghe JR. Evaluation of Sysmex UF-1000i for use in cerebrospinal fluid analysis. Clin Chim Acta 2008; 392 (1-2): 30-33
