

RSS-Feed abonnieren
DOI: 10.1055/s-0043-1775825
Salivary Trefoil Factor (TFF3) in Stage I–II Periodontitis: A Prospective Clinical Study
Autoren
Funding None.

Abstract
Objective This article evaluates the salivary trefoil factor levels using enzyme-linked immunosorbent assay and clinical parameters in stage I to II periodontitis subjects.
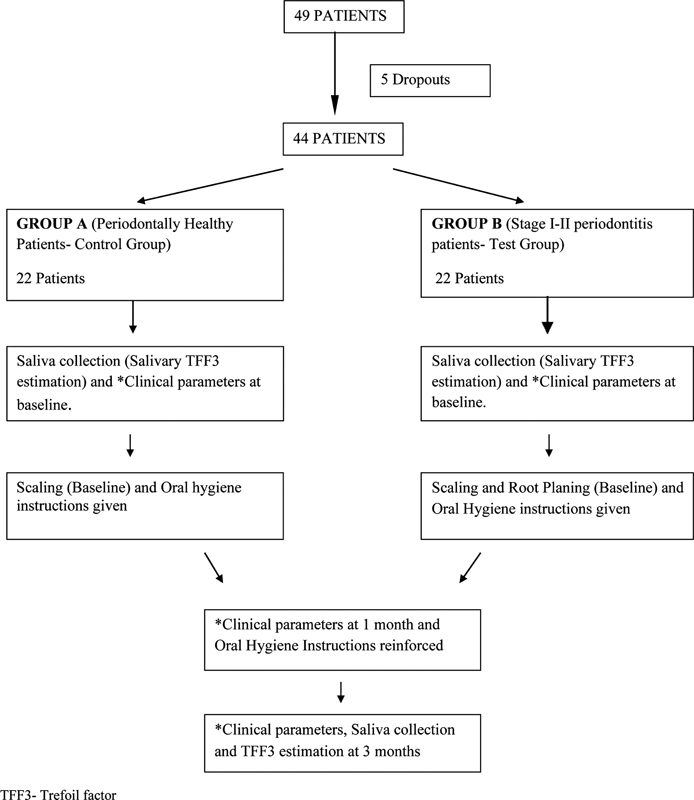
Materials and Method A total of 44 subjects with periodontitis and healthy periodontium were enrolled for the study as per the inclusion criteria. The subjects were selected and categorized as group A (control group) and group B (test group). Scaling was performed on healthy subjects at baseline and 1 month if necessary and scaling and root planing was performed for periodontitis subjects. Trefoil factor 3 (TFF3) levels was analyzed at first and post-nonsurgical periodontal therapy followed by clinical parameters, respectively.
Statistical Analysis Inferential statistics were performed using independent t-test and repeated measures of analysis of variance (ANOVA) test. Independent t-test was used for the intergroup comparison of all the variables. Repeated measures of ANOVA test along with post hoc Bonferroni test was used for the intragroup comparison and the level of statistical significance was set at 0.001.
Results Difference in TFF3 levels and clinical parameters was seen between groups A and B, which was statistically significant.
Conclusion Within the constraints of the study, it can be stated that TFF3 is a relevant biomarker to determine the activity and association of periodontal and systemic diseases, gastrointestinal disorders, and inflammatory bowel diseases.
Introduction
The human immune-inflammatory response to microbial dental plaque is the key determinant of the initiation, progression, and severity of disease. The immune cells activation triggers the release of enzymes, which leads to the breakdown of bone and connective tissue.[1] A substance that can be measured and objectively studied as an indication of healthy biologic processes, harmful biologic processes, or pharmacological reactions to therapeutic treatments is known as a biomarker, also known as a biologic marker. Antimicrobial peptides have a role in both the innate and adaptive host responses, making them an essential part for understanding the progression of periodontal well-being.[2]
TFF3, or intestinal trefoil factors, are members of a minifamily of mucin-associated proteins. The term relates to one or more 38- or 39-amino acid domains where six cysteine residues form three disulfide connections to generate a distinctive three-leafed structure. The source of TFF3 is unclear; however, a few theories have been put up for the same ([Fig. 1]). Women have much greater serum TFF3 concentrations than males and age-related decrease in TFF3 levels occurs due to fluctuations during the menstrual cycle and menopause activities.[3] TFF3 is secreted from the gastric mucosa and is associated with the various gastrointestinal diseases and inflammatory bowel diseases[4] ([Fig. 1]).

The oral epithelial immune barrier shields the number of bacteria entering the body through the oral cavity along with the food. Saliva plays a crucial part in the earliest stages of digestion as well as the preservation of teeth and the oral cavity.[5] Saliva includes a variety of proteins and peptides involved in the host defense and it is an important noninvasive biofluid for assessing the inflammatory phase of periodontal disease. In the literature, the methodology used to assess the progress of periodontal disease or the rate of disease susceptibility is inadequate. Because of the distinct diagnostic potential, saliva is considered as a source of indicator for disease activity or response to periodontal therapy. Salivary diagnostic has been considered as a “game changer” for patient assessment using saliva analysis.[6] There are no published studies done on the association of TFF3 concentrations in stage I to II periodontitis with 1 to 4 mm clinical attachment level and pocket depth of less than 5 mm.
Materials and Method
A structured prospective clinical investigation was performed on healthy and stage I to II periodontitis patients between the age groups of 20 and 40 years after approval from the ethics committee of the institution. The study was further registered under CTRI/2021/05/033596. The study was conducted only after subjects signed the patient information sheet and consent was acquired from the subjects.
The operator, patient, and assistant all adhered to the coronavirus disease 2019 standard operating protocols. Along with regular sanitization, other precautions including hand hygiene and respiratory etiquette were taken. The subjects were selected based on age, probing depth (PD), and bleeding scores. On the basis of the 2017 Classification of Periodontal and Peri-Implant Diseases[7] and based on the severity and extent of a patient's disease, the participants on the basis of bleeding on probing scores were selected and categorized as group A (control group) having less than 10% BOP and group B (test group) with more than 10% bleeding on probing (BOP).
Oral hygiene measures were given at baseline and reinforced at all time intervals. Scaling was performed on healthy subjects at baseline and 1 month if necessary. As scaling and root planing (SRP) is the nonsurgical periodontal therapy to reduce/eliminate bacterial load and to remove endotoxin from the infected cementum, SRP was performed for periodontitis subjects who were eligible for study as per the inclusion criteria and unstimulated saliva samples for the estimation of salivary TFF3 was collected at baseline and 3 months to evaluate the effect of therapy on TFF3 concentration ([Fig. 2]).
The following clinical parameters were noted at baseline, 1 month, and 3 months intervals:
-
Modified gingival index (MGI) (Lobene et al)[8]
-
Plaque index (PI) (Turesky-Gilmore-Glickman modification of the Quigley and Hein)[9]
-
Sulcus bleeding index (SBI; Mühlemann and Son)[10]
-
PD (using UNC-15 probe)
-
Interdental clinical attachment loss (CAL) (using UNC-15 probe)
TFF3 Estimation
Unstimulated saliva was taken from all the subjects at initial visit and third visit, coded in Eppendorf tubes, and the biochemical analysis was done where the analyst was blinded toward the groups. The subjects were abstained from eating and drinking 1 hour before the collection of saliva. Three milliliters of saliva was collected using suction method (syringes without needle).[11]
The samples were stored at –80°C until analysis was done. The biochemical analysis was done after adding 97 µL of distilled water and the final volume of saliva obtained after dilution was 100 µL. The analysis was done with enzyme-linked immunosorbent assay (ELISA) reader of BeneSphera using the ElabScience kit using the sandwich-ELISA principal.[12]
Results
Clinical Parameters
The mean PI change for group B was 0.52 ± 0.27, 0.20 ± 0.24, and 0.72 ± 0.37 and in group A was 0.02 ± 0.01, 0.01 ± 0.00, and 0.02 ± 0.00 from baseline to first subsequent visit, first to third month, and baseline to third month, respectively. Mean MGI changed significantly from baseline to 1 month, and from 1 to 3 months for both groups A and B. Mean changes in SBI in group A were 0.0009 ± 0.009, 0.011 ± 0.009, and 0.125 ± 0.004 and in group B were 0.53 ± 0.26, 0.74 ± 0.28, and 0.21 ± 0.14 from baseline to 1 month, baseline to 3 months, and between 1 and 3 months, respectively. This comparison concluded significant changes in SBI scores for group A and B ([Table 1]). The mean change in probing depth (PD) for group A was 0.00 ± 0.00, 0.00 ± 0.00, and 0.00 ± 0.00 and in group B was 0.36 ± 0.49, 1.27 ± 0.45, and 0.90 ± 0.42 from baseline to first month, baseline to third month, and from first to third month, respectively, during the comparison between the two groups. The mean CAL scores in group A were 0.00 ± 0.00, 0.00 ± 0.00, and 0.00 ± 0.00 and in group B were 0.31 ± 0.47, 1.13 ± 0.46, and 0.81 ± 0.50 from baseline to first month, baseline to third month, and from first to third month, respectively. The mean change in clinical attachment level from baseline to first month, from first to third month, and from baseline to third month in group B was significantly significant ([Table 2]).
Abbreviations: MGI, modified gingival index; PI, plaque index; SBI, sulcus bleeding index; SD, standard deviation; S, significant.
|
Mean |
SD |
Mean |
SD |
Mean |
SD |
|
|---|---|---|---|---|---|---|
|
Probing depth (PD) |
||||||
|
Healthy group (group A) |
0.0000 |
0.00000 |
0.0000 |
0.00000 |
0.0000 |
0.00000 |
|
Periodontitis group (group B) |
0.3636 |
0.49237 |
0.9091 |
0.42640 |
1.2727 |
0.45584 |
|
p-Value of intergroup comparison between group A and B |
0.002[a]S |
< 0.001[a]S |
< 0.001[a]S |
|||
|
p-Value of intragroup comparison among group A |
− |
− |
− |
|||
|
p-Value of intragroup comparison among group B |
0.013[a]S |
< 0.001[a]S |
< 0.001[a]S |
|||
|
Clinical attachment loss (CAL) |
||||||
|
Healthy group (group A) |
0.0000 |
0.00000 |
0.0000 |
0.00000 |
0.0000 |
0.00000 |
|
Periodontitis group (group B) |
0.3182 |
0.47673 |
0.8182 |
0.50108 |
1.1364 |
0.46756 |
|
p-Value of intergroup comparison between group A and B |
0.005, S |
< 0.001, S |
< 0.001, S |
|||
|
p-Value of intragroup comparison among group A |
− |
− |
− |
|||
|
p-Value of Intragroup comparison among group B |
0.01[b]NS |
< 0.001[a]S |
< 0.001[a]S |
|||
Abbreviations: NS, nonsignificant; S, significant; SD, standard deviation.
a p < 0.001.
b p > 0.001.
Biochemical Parameters
The mean increase in TFF3 in group B was higher than in group A. In both groups, the mean change of TFF 3 recorded posttreatment was 0.07 ± 0.12 and 0.39 ± 0.30, respectively. Statistically significant results were obtained for the mean TFF3 change from baseline to first month, first to third month, and baseline to third month in group B ([Table 3]).
Abbreviations: SD, standard deviation; TFF3, trefoil factor 3.
Discussion
Periodontitis is characterized by change in bacterial pathogenicity leading to deterioration and destruction of the supporting structures of the teeth including the alveolar bone. The symptoms include gingival bleeding, pocket formation, interdental attachment loss, and resorption of bone. A new classification of periodontitis was proposed in 2017, based on the extent and severity of the disease. Periodontal health and gingival inflammation were the key points of discussion in this workshop.[13]
TFF3 is chosen out of the three trefoil factors as the salivary biomarker since TFF1 and TFF2 were shown to have no noticeable impact on the keratinocytes of the mouth. Also, its concentrations in gingival tissues did not significantly change in people with periodontally healthy gingiva.[11] Abundance and the noninvasive method of collection of saliva constitute it as the chosen medium for evaluation of the biomarker TFF3.
The intragroup comparison of the clinical parameters for both groups showed significant changes from baseline to 1 month. These results are attributed to the impact of nonsurgical periodontal therapy (SRP) in group B and scaling in group A, which is regarded as the benchmark for the treatment of periodontitis for stage I and II periodontitis.[14] The changes in these scores were significant in both groups from the initial level to third month and from 1 to 3 months.[15] These outcomes were related to the efficient use of standardized oral hygiene instructions throughout the study time period after the baseline treatment.[16]
On intergroup comparisons, there was a statistically significant change obtained in clinical parameters. This occurs because of the reduction in proteolytic activity of microorganisms and reduction of oxidative stress after nonsurgical therapy which further leads to the reduction in periodontal inflammation. However, subjects with periodontitis continue to have a higher chance of recurrence and hence they do not become nonperiodontitis subjects unless they are kept on professional mechanical plaque removal regimen.[17] On intergroup comparisons of PD and CAL, there was a statistically significant difference seen at all time intervals between the groups. This is because more subjects were included from stage II periodontitis according to the 2017 Classification of Periodontal and Peri-Implant Diseases.[18]
The intragroup comparison of the TFF3 scores for both groups showed significant changes from baseline to 3 months. Gingival tissues of chronic periodontitis subjects reported lower levels of TFF3 along with its expression compared with the healthy group.[18]
Intergroup comparison of mean TFF showed that at baseline the mean TFF remained high in group A compared with group B, whereas it was reversed after 3 months of SRP.
Also, the mean change in TFF levels in group B continued to be higher than in group A.
This is because TFF3 is linked to periodontitis and after scaling also, nonperiodontitis state cannot be achieved according to the 2017 classification. The levels of TFF3 were shown to be negatively correlated with the other periodontal parameters. These results complemented the findings of the study done by Meesala et al[11] and Keles Yucel et al[2] where salivary TFF3 increased after nonsurgical periodontal treatment in periodontitis subjects. Therefore, it was suggested for periodontal degradation leading to inflammation and cellular damage, TFF3 might be upregulated to ensure epithelial restoration and formation of new periodontal tissues.
The limitations of the study include separate analysis done for both the stages of periodontitis, that is, stage I and stage II. An estimation of biomarker, that is, TFF3, should be performed at 1 month and microbiological analysis could have been done along with the estimation of TFF3.
Conclusion
Within the constraints of the study, it can be stated that TFF3 is an important biomarker to determine the activity of periodontal disease. It is advised that the subjects should be kept in maintenance therapy at all intervals. An additional long-term longitudinal study with bigger sample size should be conducted to assess the importance of TFF3 levels in periodontitis subjects.
Future Prospective
TFF3 is a protein anti-inflammatory biomarker secreted from salivary glands, from gastric mucosa, and is associated with gastrointestinal diseases and inflammatory bowel disease. It would act as a systemic diseases indicator and a link between periodontal disease and systemic diseases.
Conflict of Interest
None declared.
-
References
- 1 Taalab MR, Mahmoud SA, Moslemany RME, Abdelaziz DM. Intrapocket application of tea tree oil gel in the treatment of stage 2 periodontitis. BMC Oral Health 2021; 21 (01) 239
- 2 Keles Yucel ZP, Afacan B, Atmaca İlhan H, Kose T, Emingil G. The trefoil factor family 1 (TFF-1) and 3 (TFF-3) are upregulated in the saliva, gingival crevicular fluid and serum of periodontitis patients. Oral Dis 2022; 28 (04) 1240-1249
- 3 Vestergaard EM, Poulsen SS, Grønbaek H. et al. Development and evaluation of an ELISA for human trefoil factor 3. Clin Chem 2002; 48 (10) 1689-1695
- 4 Aihara E, Engevik KA, Montrose MH. Trefoil factor peptides and gastrointestinal function. Annu Rev Physiol 2017; 79: 357-380
- 5 Houben T, Harder S, Schlüter H, Kalbacher H, Hoffmann W. Different forms of TFF3 in the human saliva: heterodimerization with IgG Fc binding protein (FCGBP). Int J Mol Sci 2019; 20 (20) 5000-5016
- 6 Haririan H, Andrukhov O, Laky M. et al. Saliva as a source of biomarkers for periodontitis and periimplantitis. Front Dent Med 2021; 2: 687638-687646
- 7 Papapanou PN, Sanz M, Buduneli N. et al. Periodontitis: consensus report of workgroup 2 of the 2017 World Workshop on the Classification of Periodontal and Peri-Implant Diseases and Conditions. J Periodontol 2018; 89 (Suppl. 01) S173-S182
- 8 Lobene RR, Weatherford T, Ross NM, Lamm RA, Menaker L. A modified gingival index for use in clinical trials. Clin Prev Dent 1986; 8 (01) 3-6
- 9 Turesky S, Gilmore ND, Glickman I. Reduced plaque formation by the chloromethyl analogue of vitamin C. J Periodontol 1970; 41 (01) 41-43
- 10 Mühlemann HR, Son S. Gingival sulcus bleeding–a leading symptom in initial gingivitis. Helv Odontol Acta 1971; 15 (02) 107-113
- 11 Meesala D, Penmetsa GS, Dwarakanath CD, Manyam R. Effect of initial periodontal therapy on salivary trefoil factor (TFF3) in otherwise healthy subjects with gingivitis and chronic periodontitis. Contemp Clin Dent 2018; 9 (Suppl. 01) S11-S16
- 12 Engvall E. The ELISA, enzyme-linked immunosorbent assay. Clin Chem 2010; 56 (02) 319-320
- 13 Caton JG, Armitage G, Berglundh T. et al. A new classification scheme for periodontal and peri-implant diseases and conditions - introduction and key changes from the 1999 classification. J Periodontol 2018; 89 (Suppl. 01) S1-S8
- 14 Palwankar P, Rana M, Arora K, Deepthy C. Evaluation of non-surgical therapy on glutathione levels in chronic periodontitis. Eur J Dent 2015; 9 (03) 415-422
- 15 Pranam S, Palwankar P, Pandey R, Goyal A. Evaluation of efficacy of coenzyme Q10 as an adjunct to nonsurgical periodontal therapy and its effect on crevicular superoxide dismutase in patients with chronic periodontitis. Eur J Dent 2020; 14 (04) 551-557
- 16 Palwankar P, Jain S, Pandey R, Mahesh S. IgA levels among Type 2 diabetic and non-diabetic patients with periodontitis: a prospective clinical study. Eur J Dent 2023; 17 (03) 823-827
- 17 Chapple ILC, Mealey BL, Van Dyke TE. et al. Periodontal health and gingival diseases and conditions on an intact and a reduced periodontium: consensus report of workgroup 1 of the 2017 World Workshop on the Classification of Periodontal and Peri-Implant Diseases and Conditions. J Periodontol 2018; 89 (Suppl. 01) S74-S84
- 18 Choi YM, Lee JY, Choi J, Joo JY. Effect of root planing on the reduction of probing depth and the gain of clinical attachment depending on the mode of interproximal bone resorption. J Periodontal Implant Sci 2015; 45 (05) 184-189
Address for correspondence
Publikationsverlauf
Artikel online veröffentlicht:
06. November 2023
© 2023. The Author(s). This is an open access article published by Thieme under the terms of the Creative Commons Attribution License, permitting unrestricted use, distribution, and reproduction so long as the original work is properly cited. (https://creativecommons.org/licenses/by/4.0/)
Thieme Medical and Scientific Publishers Pvt. Ltd.
A-12, 2nd Floor, Sector 2, Noida-201301 UP, India
-
References
- 1 Taalab MR, Mahmoud SA, Moslemany RME, Abdelaziz DM. Intrapocket application of tea tree oil gel in the treatment of stage 2 periodontitis. BMC Oral Health 2021; 21 (01) 239
- 2 Keles Yucel ZP, Afacan B, Atmaca İlhan H, Kose T, Emingil G. The trefoil factor family 1 (TFF-1) and 3 (TFF-3) are upregulated in the saliva, gingival crevicular fluid and serum of periodontitis patients. Oral Dis 2022; 28 (04) 1240-1249
- 3 Vestergaard EM, Poulsen SS, Grønbaek H. et al. Development and evaluation of an ELISA for human trefoil factor 3. Clin Chem 2002; 48 (10) 1689-1695
- 4 Aihara E, Engevik KA, Montrose MH. Trefoil factor peptides and gastrointestinal function. Annu Rev Physiol 2017; 79: 357-380
- 5 Houben T, Harder S, Schlüter H, Kalbacher H, Hoffmann W. Different forms of TFF3 in the human saliva: heterodimerization with IgG Fc binding protein (FCGBP). Int J Mol Sci 2019; 20 (20) 5000-5016
- 6 Haririan H, Andrukhov O, Laky M. et al. Saliva as a source of biomarkers for periodontitis and periimplantitis. Front Dent Med 2021; 2: 687638-687646
- 7 Papapanou PN, Sanz M, Buduneli N. et al. Periodontitis: consensus report of workgroup 2 of the 2017 World Workshop on the Classification of Periodontal and Peri-Implant Diseases and Conditions. J Periodontol 2018; 89 (Suppl. 01) S173-S182
- 8 Lobene RR, Weatherford T, Ross NM, Lamm RA, Menaker L. A modified gingival index for use in clinical trials. Clin Prev Dent 1986; 8 (01) 3-6
- 9 Turesky S, Gilmore ND, Glickman I. Reduced plaque formation by the chloromethyl analogue of vitamin C. J Periodontol 1970; 41 (01) 41-43
- 10 Mühlemann HR, Son S. Gingival sulcus bleeding–a leading symptom in initial gingivitis. Helv Odontol Acta 1971; 15 (02) 107-113
- 11 Meesala D, Penmetsa GS, Dwarakanath CD, Manyam R. Effect of initial periodontal therapy on salivary trefoil factor (TFF3) in otherwise healthy subjects with gingivitis and chronic periodontitis. Contemp Clin Dent 2018; 9 (Suppl. 01) S11-S16
- 12 Engvall E. The ELISA, enzyme-linked immunosorbent assay. Clin Chem 2010; 56 (02) 319-320
- 13 Caton JG, Armitage G, Berglundh T. et al. A new classification scheme for periodontal and peri-implant diseases and conditions - introduction and key changes from the 1999 classification. J Periodontol 2018; 89 (Suppl. 01) S1-S8
- 14 Palwankar P, Rana M, Arora K, Deepthy C. Evaluation of non-surgical therapy on glutathione levels in chronic periodontitis. Eur J Dent 2015; 9 (03) 415-422
- 15 Pranam S, Palwankar P, Pandey R, Goyal A. Evaluation of efficacy of coenzyme Q10 as an adjunct to nonsurgical periodontal therapy and its effect on crevicular superoxide dismutase in patients with chronic periodontitis. Eur J Dent 2020; 14 (04) 551-557
- 16 Palwankar P, Jain S, Pandey R, Mahesh S. IgA levels among Type 2 diabetic and non-diabetic patients with periodontitis: a prospective clinical study. Eur J Dent 2023; 17 (03) 823-827
- 17 Chapple ILC, Mealey BL, Van Dyke TE. et al. Periodontal health and gingival diseases and conditions on an intact and a reduced periodontium: consensus report of workgroup 1 of the 2017 World Workshop on the Classification of Periodontal and Peri-Implant Diseases and Conditions. J Periodontol 2018; 89 (Suppl. 01) S74-S84
- 18 Choi YM, Lee JY, Choi J, Joo JY. Effect of root planing on the reduction of probing depth and the gain of clinical attachment depending on the mode of interproximal bone resorption. J Periodontal Implant Sci 2015; 45 (05) 184-189