

Subscribe to RSS
DOI: 10.1055/s-0043-1760852
Resting-State Functional MRI/PET Profile as a Potential Alternative to Tri-Modality EEG-MR/PET Imaging: An Exploratory Study in Drug-Refractory Epilepsy
Authors

Abstract
Objective The study explores whether the epileptic networks associate with predetermined seizure onset zone (SOZ) identified from other modalities such as electroencephalogram/video electroencephalogram/structural MRI (EEG/VEEG/sMRI) and with the degree of resting-state functional MRI/positron emission tomography (RS-fMRI/PET) coupling. Here, we have analyzed the subgroup of patients who reported having a seizure on the day of scan as postictal cases and compared the findings with interictal cases (seizure-free interval).
Methods We performed independent component analysis (ICA) on RS-fMRI and 20 ICA were hand-labeled as large scale, noise, downstream, and epilepsy networks (Epinets) based on their profile in spatial, time series, and power spectrum domains. We had a total of 43 cases, with 4 cases in the postictal group (100%). Of 39 cases, 14 cases did not yield any Epinet and 25 cases (61%) were analyzed for the final study. The analysis was done patient-wise and correlated with predetermined SOZ.
Results The yield of finding Epinets on RS-fMRI is more during the postictal period than in the interictal period, although PET and RS-fMRI spatial, time series, and power spectral patterns were similar in both these subgroups. Overlaps between large-scale and downstream networks were noted, indicating that epilepsy propagation can involve large-scale cognition networks. Lateralization to SOZ was noted as blood oxygen level–dependent activation and correlated with sMRI/PET findings. Postoperative surgical failure cases showed residual Epinet profile.
Conclusion RS-fMRI may be a viable option for trimodality imaging to obtain simultaneous physiological information at the functional network and metabolic level.
Keywords
epilepsy - epileptic network - resting-state functional MRI - fluorodeoxyglucose - positron emission tomography - temporal lobe epilepsyIntroduction
Identifying the correct epileptogenic zone with various presurgical tools is vital in patients with drug-refractory epilepsy undergoing epilepsy surgery for successful surgical outcomes. Although positron emission tomography (PET) has limited spatiotemporal resolution, it provides an excellent metabolic signature of the symptomatic zone in epilepsy.[1] Fundamentally, the blood oxygen level–dependent (BOLD) signal and the regional glucose metabolism represent neuronal bioenergetics and can be correlated with simultaneous magnetic resonance imaging–PET (MRI/PET). The surgical resection can be planned based on information from various modalities, and with the advent of neuromodulation techniques imaging, the planning becomes crucial. Among the multimodality imaging techniques, resting-state functional MRI (RS-fMRI) has an excellent spatial resolution for in vivo imaging of dynamic functional networks.[1] Since epilepsy is a system network disorder, the degree of network recruitment is affected by genetic predisposition, duration, age of onset, and severity.[1]
The RS-fMRI signals can be represented as spatial maps, power spectrum, and time series; the time series is sluggish, spectral analysis is comparable, and spatial resolution is better when compared with electroencephalogram (EEG). The lesion can induce an aberrant functional network called epilepsy network (Epinet) and recruit large-scale networks called downstream networks for the seizure propagation. These components of the network can help predict the temporal evolution of the clinically observed phenomenon, the kindling of the seizure onset zone (SOZ) and associated long-term behavioral changes.[2] [3] [4] [5] [6] [7] [8] [9]
The aim of the study is to determine whether the Epinets correlate or overlap with predetermined SOZ from other modalities and the degree of RS-fMRI/PET coupling. A subgroup RS-fMRI/PET analysis on interictal and postictal groups is also planned.
Methods
The RS-fMRI/PET acquired from January 2016 to December 2018 at a tertiary care referral hospital is retrospectively reviewed. Written informed consent was obtained from all the patients before starting the MRI/PET study. The study received approval from the institutional ethical committee (No. NIMH/DO/[BS & NS DIV.]/2019–2020). Patients diagnosed with drug-refractory temporal lobe epilepsy (TLE) due to hippocampal sclerosis who underwent a hybrid MRI/PET study were included. Forty-three patients (25 male and 18 female patients; age range: 15–51 years; mean: 21 years) and 10 healthy controls (4 male and 6 female participants; mean age: 25 years) were included for this study. Baseline data including clinical and video-EEG (VEEG), EEG, structural MRI (sMRI) findings, and the likely SOZ were identified before the scan.
Inclusion criteria were patients with drug-resistant TLE with features of unilateral or bilateral hippocampal sclerosis on sMRI. Patients underwent simultaneous MRI/PET study with RS-fMRI in the study protocol and during the interictal period/postictal period.
Exclusion criteria were not consenting, pregnancy, MRI-incompatible devices, ongoing seizures, self-reporting as being unwell or not cooperative for scan, and image quality not adequate for analysis of RS-fMRI and/or PET data.
The interictal and postictal phases are interchangeably used in the literature with the postictal phase extending from a few minutes to days. In this study, subjects who did not report aura, habitual seizure, or any abnormal episodes before, during uptake, and MRI/PET scan, were on medication, and cooperative for scan were termed interictal cases (n = 39). Study subjects who self-reported aura, seizures, and abnormal episodes approximately 3 hours before the scan and who self-reported as being normal during the scan and were cooperative were termed postictal cases (n = 4). Ictal cases were excluded from this study.
MRI/PET Sequence
Simultaneous RS-fMRI/PET data were acquired (subjects were asked to relax and keep their eyes open without falling asleep) using a 3T Biograph mMR scanner (Siemens Healthcare, Erlangen, Germany). The patients rested in a quiet and warm dark room for 15 minutes before fluorodeoxyglucose (FDG) administration and during the uptake period. Simultaneous PET and RS-fMRI data acquisition started 30 minutes following the intravenous injection of the recommended standard dose of 18F-FDG (5 MBq/kg): (1) three-dimensional T1-weighted magnetization-prepared rapid acquisition gradient-echo sequence (MPRAGE, 176 sagittal planes, 256 × 240 mm2 fields of view [FOVs], voxel size 1 × 1 × 1 mm3, repetition time/time to echo/inversion time [TR/TE/TI] 2,300/2.96/900 ms, flip angle 9 degrees, time of acquisition (TA) = 5′14″); (2) the RS-fMRI protocol was a T2*-weighted single-shot EPI sequence (voxel size 4 × 4 × 4 mm3, TR/TE = 1,920/32 ms, flip angle = 90 degrees, 250 time points, FOV read = 256, distance factor = 0, TA= 8′).
Preprocessing: RS-fMRI data were pre-processed using FMRIB's software Library (FSL) tool with following steps: head motion and slice-timing corrections, intensity normalization, removing nonbrain tissue by brain extraction tool (BET). Moreover, data were temporally high-pass filtered at 0.01 Hz. Individual functional scans were registered to the patient's high-resolution anatomical scan using linear registration and optimized using boundary-based registration. All subjects had less than 0.5-mm head motion displacement in any direction. Twenty independent component analyses (ICAs) were generated by ICA. These oscillating subsignals/components can represent either brain networks or noise. The ICA was divided as shown in the following, and the spatiotemporal and power spectrum features are given in the algorithm ([Table 1]) developed from reported published literature.[2] [3] [4] [5] [6] [7] [8] [9]
|
Noise |
Large-scale neuronal network/typical RSN |
Downstream epileptogenic propagation/atypical RSN |
Epinet/SZ |
|
|---|---|---|---|---|
|
Spatial maps |
Not respecting anatomical boundary, primarily over vessels/CSF/WM, alternating slices/not over gray matter/brain–air interface/EPI dropout in the phase encoding direction/alternate activation and deactivation in only one slice. Spatial distribution consistent with machine-generated artifacts such as skipping slices |
Clear known bilateral/unilateral RSN are established[25] Primary sensory-motor networks, parietal networks, frontal networks, visual networks, the default mode network, and the deep gray networks located with the bilateral putamen and bilateral mesial thalami |
RSN location but incomplete spatial coverage RSN like spatially but overlapping with SOZ |
Localized to gray matter but not RSN pattern unilateral. The alternating positive and negative hemodynamic alteration, tail extending outward into WM toward ventricles. Irregular border Should overlap with area localized on EEG/PET/MRI/MEG but not with RSN |
|
Temporal graph |
Erratic time course/regular oscillation pattern Majority of cycles have period changes < 50% of baseline |
Low oscillation frequency < 0.073 Hz The slow, regular, and smooth oscillating pattern Cycles have no spikes and change in period < 50% period value between cycles |
High oscillation frequency > 0.073 Hz Smooth sinusoidal oscillation overlaid with regular milder frequency disruption/irregular frequency sharp contoured bursts returning to normal Cycles have < 50% less change in the period between cycles |
High oscillation frequency > 0.073 Hz Erratic irregular low and high frequency with sharp contours of faster frequency than baseline with or without return to baseline Cycles have a change in a period > 50% of baseline between cycles |
|
Power spectrum |
Powerband out of low range along with high range bands > 0.039 Hz if the cardiac or respiratory band |
Powerband in low range < 0.039HZ with high range band if near EZ |
High band with low range to > 0.04 Hz |
High band with low range to > 0.04 Hz |
|
Our observation |
||||
|
Spatial maps |
Physiological noise: CSF/vessel location Artifactual: nonbiological behavior/unknown pattern |
Some of these networks may be missing or have deactivated morphology—indicate dysfunction of normal network |
The pattern was intermediate of large scale and Epinet and may be normal networks that have been upregulated for seizure propagation |
Unknown network close to the EZ—represent disrupted local brain function, If > 1 Epinet is noted, it represents subnetwork if all these are in the same location and when overlaid a bull's eye pattern is noted If they are noted in different locations, then it indicates the possibility of multifocal EZ |
|
Power spectrum |
Peaks start with very low range power (y-axis) in lower frequency (0.01–0.08 Hz) and intermediate band (0.08–0.16 Hz) and peaks in very high range power in the high-frequency band (0.16–0.24) in the spectrum |
Peaks show low to high range power (y-axis) in low-frequency band within < 0.04 Hz (x-axis) and peaks fall flat in power in the intermediate frequency band (x-axis) in the spectrum |
Peaks show low to range high range power (y-axis) in low-frequency band > 0.04Hz (x-axis) and peaks continue with very low range power in the rest of intermediate and high-frequency bands in the spectrum |
Peaks show low to high range power (y-axis) in low-frequency band > 0.04Hz (x-axis) and peaks continue with very low range power in the rest of the high and intermediate frequency band in the spectrum |
|
Temporal graph y-axis normalized response |
−4 to +4 range |
−10 to +5 range |
−4 to +4 range |
−2 to +4 range |
Abbreviations: CSF, cerebrospinal fluid; EEG, electroencephalogram; EPI, echo-planar imaging; EZ, epileptogenic zone; MEG, magnetoencephalography; MRI, magnetic resonance imaging; PET, positron emission tomography; RSN, resting-state network; SOZ, seizure onset zone; SZ, seizure zone; WM, white matter.
Power spectrum: Conversion on the x-axis–(Hz/100) × 0.01 = (Hz) Eg: 4 Hz/100 = 0.04 Hz
Temporal graph conversion on the x-axis–TR = 1.920 s × 250 time points = 480
Analysis and Interpretation
Resting-state SOZ/Epinets were identified by spatial features if they are primarily located within gray matter but not in resting-state network (RSN) spatial pattern and were correlated with suspected seizure foci on MRI/PET/EEG/VEEG.[2] [3] [4] [5] [6] [7] [8] [9]
Artifacts/noise: Signal arising from the motion, susceptibility, sagittal sinus vein, cerebrospinal fluid, white matter regions, cardiac, and respiratory cycle ([Fig. 1A]).
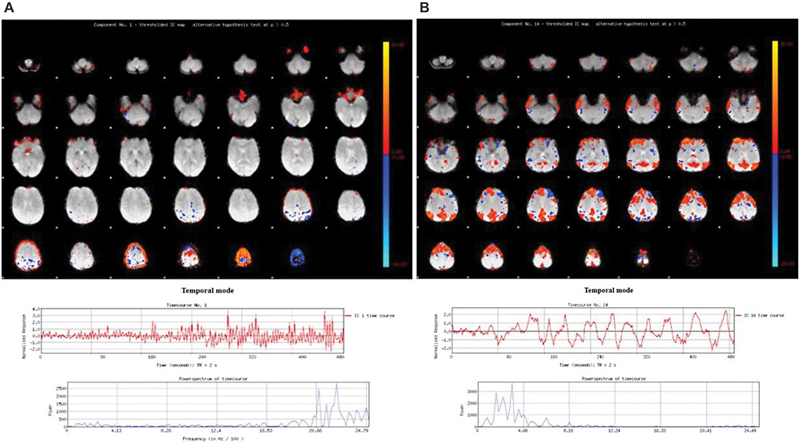
Large-scale network/RSN/neuronal networks: We correlated with the known large-scale networks on spatiotemporal and power spectrum parameters and deduced the 10 large-scale networks with the highest correlation ([Fig. 1B]).[2] [3] [4] [5] [6] [7] [8] [9]
Downstream/atypical RSN: Networks with weaker correlation with large-scale networks on spatial parameters but having temporal and power spectrum profile intermediate to large scale and Epinets ([Fig. 2A]).[2] [3] [4] [5] [6] [7] [8] [9]

The first step was a correlation with the known large-scale networks of RSN networks. We then filtered out noise/artifacts and hand-labeled downstream RSN. The unknown networks were analyzed as potential Epinets based on spatiotemporal series and power spectrum definition. The potential Epinet ICA was then correlated for overlap with SOZ. If more than one Epinets were found, they were overlaid with each other. The seizure network can fragment into subnetworks. The same processing technique was used in healthy controls to rule out false-positive/noise mimicking Epinets.
This is an exploratory study on a large case series, and analysis was done on a per-patient basis. Detailed results are available in [Supplementary Table S1] (available in the online version only).
Results
Of 43 patients, 39 patients were in the interictal phase and 4 patients were in the postictal phase. Since 14 cases did not yield any Epinets in the interictal phase, only 25 cases were analyzed. The likely SOZ was based on clinical EEG, VEEG, and mesial temporal sclerosis (MTS) on sMRI ([Supplementary Table S1], available in the online version only). In the interictal subgroup (n = 25), 13 had left MTS, 10 had right MTS, and 2 had bilateral MTS. In the postictal subgroup (n = 4), there were two each of left MTS and right MTS. Details of 20 ICA classification are given in [Supplementary Table S1] (available in the online version only).
Algorithm and Our Observations
Our observation of spatiotemporal and power spectra profiles is given in [Table 1]. Noise could be either nonbiological or physiological contamination from cerebrospinal fluid, artery, or vein ([Fig. 1A]). Few patients had missing large-scale networks or had a deactivated morphology ([Fig. 1B]). The downstream networks had a behavior intermediate between large scale and Epinets ([Fig. 2A]). The Epinets were close to the SOZ, indicating a disrupted local brain network ([Fig. 2B]), and were often more than one. When these were overlaid upon each other, they formed a bull's eye pattern over the SOZ ([Fig. 6]). Figures of right MTS ([Fig. 3]), left MTS ([Fig. 4A]), interictal phase, and postictal phase ([Fig. 4B]) are provided. The power spectrum of Epinets was higher than the normal RSN. On a time series graph when the normalized response (y-axis) was analyzed, the large scales had values ranging from −10 to +5, whereas downstream had values ranging from −4 to +4 and Epinets had values ranging from −2 to +4 range, indicating that Epinets were faster in frequency.


Healthy control ICA versus epilepsy ICA: None of the healthy controls had Epinet/downstream-like network profile. An average of 7 to 13 large-scale networks were noted in controls, and patients had 3 to 7 large-scale networks and 2 to 7 downstream networks. Noise components were similar across both the groups.
Bilateral versus unilateral MTS: The number of Epinets and downstream networks was similar across bilateral, right, and left MTS. In the two cases with bilateral MTS, case 32 had left lateralization and case 37 had right lateralization. When they were correlated with PET and RS-fMRI, the lateralization was similar. In case 2 and case 12, the sMRI showed MTS on right and left sides, respectively, with PET showing bilateral hypometabolism (more significant on the side of MTS). Epinets too showed lateralization to the side of MTS.
Activations/deactivation pattern on RS-fMRI and PET metabolic correlation: There was no significant difference in the pattern of activation and deactivation in the Epinets of both postictal and interictal groups. The RS-fMRI pattern did not correlate with the metabolic pattern on PET. The SOZ showed positive BOLD activation on RS-fMRI, whereas PET showed decreased metabolism (negative correlation).
Interictal versus postictal: The yield of finding Epinets in the 9-minute scan was 100% (4/4) in the postictal phase and 61% (25/39) in the interictal phase.
When the pattern of behavior was noted between the interictal and postictal groups, the spatiotemporal and power spectrum behavior was similar but the likelihood of finding Epinets was more in the postictal group. PET had hypometabolism in the SOZ across both groups. We did not have any cases with prolonged postictal states such as drowsiness, confusion, and disorientation in this series ([Figs. 2B], [3], and [4A]).
Lateralizing value of RS-fMRI with other modalities: RS-fMRI overlapped with SOZ and BOLD activation lateralized to the side of SOZ.
Epinets in RS-fMRI and PET correlation: On RS-fMRI, Epinets were more in the postictal phase but PET was similar in both subgroups and had hypometabolism at SOZ.
Epinets overlapping with SOZ (right or left MTS): With MTS as the structural lesion, all the Epinets were overlapped with each other and correlated with SOZ. The other areas activated in the network may be for seizure propagation or potential epilepsy zones that need further study ([Figs. 3] and [4A]).
Postoperative cases: There were two cases, one each in interictal and postictal groups, with persistent drug-refractory epilepsy in the postoperative period. Residual Epinets were noted in these cases. We did not have pre- and postoperative cases for comparison ([Fig. 5A,B]).


Discussion
The International League Against Epilepsy defines a seizure as a transient occurrence of signs and/or symptoms due to abnormal excessive or synchronous neuronal activity in the brain, which are easily perceived by the patient or observed by others. A seizure stops due to a variety of potential mechanisms such as energy substrate depletion, receptor desensitization, depolarization block, desynchronization of neuronal networks, GABAergic and non-GABAergic inhibition, hyperpolarizing sodium–potassium pump potentials, and inhibitory neuromodulators at subcellular levels. There is no clear-cut demarcation between the interictal and postictal phases. The postictal phase is the period after a seizure that can overlap with the interictal phase. Behavioral and cognitive change in these phases may be a continuum.[10] [11] [12]
EEG–PET studies in the postictal phase have shown that although we expect a postictal hypometabolism and normal EEG baseline, 10% had persistent hypermetabolism on PET and only 31% showed a normal EEG baseline after 12 to 24 hours.[13] The post-ictal period is affected by type, duration, and number of seizures. EEG–RS-fMRI studies have shown widespread BOLD changes before clinical onset and after clinical resolution of the seizure[13] and the postictal showed either abrupt return, stuttering, or no return to baseline. The timescale is in milliseconds, seconds, or minutes for EEG–RS-fMRI/PET, hence the variability across these modalities. All these dynamic changes put together may result in behavior change and is subjective. Clinically, there is a continuum of aura or a fugue state to seizure to a normal state again, which is highly variable across patients.
The interictal period could represent an abnormal baseline, a fact established by interictal PET showing hypometabolism, although it may appear normal clinically on sMRI and EEG. An EEG–RS-fMRI study has shown abnormal activations, although clinical EEG had no interictal epileptic discharge (IED).[14] Our study has explored the role of RS-fMRI and clinical EEG and whether a linear correlation exists in the interictal phase. When the subgroups were compared, Epinets were more in number in the postictal group. In 39% of the cases, there were no identifiable Epinets, which might have been due to a short scan interval of 9 minutes. Postictal networks may represent pathological upregulated networks that lag to return to baseline and doing a scan during this phase can increase the yield. Epinets represent an aberrant network at baseline and are footprints of earlier seizure activity. PET was similar in both the subgroups because all the transient neurohemodynamic physiological changes in the timescale of seconds may not be captured. The pattern of deactivation and activation on RS-fMRI did not linearly correlate with the hypo- and hypermetabolic pattern of PET. This is expected as SOZ in the interictal period has decreased metabolism but being a seizure focus has activated BOLD signals. In an EEG–RS-fMRI/PET study, the fast-wave component of EEG correlated with positive BOLD and slow-wave component increased local field potential (LFP) and decreased mean firing rate of EEG during spike period correlated with BOLD deactivation. However, deactivation on RS-fMRI could also mean vascular steal phenomenon, venous flow, and inhibitory neurotransmitter activity.[15] Lateralization by RS-fMRI/PET for SOZ correlated well. In an EEG–RS-fMRI study, in the preictal, postictal, and interictal states, the lateralization to SOZ was maintained.[13] In the two cases with bilateral MTS, the lateralization with sMRI, PET, and RS-fMRI was similar as they represented the same brain state.
The smaller timescales and dynamic perturbations caused by epilepsy transients are well captured by RS-fMRI, whereas PET represents global change. An EEG–PET showed EEG perturbations to be far more extensive than the metabolic changes.[16] [17] These epilepsy transients represented by Epinets indicate baseline abnormality capable of having a transition from interictal to ictal state.[18] The number of postictal Epinets is more than in the interictal phase.
Research on normal RS-fMRI has shown that the BOLD changes can be subdivided into slow-wave 5 to slow-wave 1,[19] and that Epinets can be discriminated with the highest accuracy at 0.01 to 0.073 Hz.[20] This analogy is similar to the frequency spectral bands of EEG with a high-frequency band corresponding to epilepsy. Noise (physiological and artifactual) can be either regular or erratic. Epinets have a biological profile of normal RSN but with higher frequency and magnitude. Interpreting Epinets needs correlation with spatial map, power spectrum, and time series, and a clinically relevant inference can be derived by a change in pattern in the post-surgery phase. A transition from higher to lower frequency band and decrease in oscillation frequency on time series graph and lack of BOLD signal at the resected site carries a good prognosis. The change in the RS-fMRI profile may not be abrupt but the tendency of the RS-fMRI profile to improve or persist can dictate the outcome.[2] [3] [4] The epileptogenic lesion from sMRI and RS-fMRI zone by overlapping Epinets at SOZ correlate partially. Hence, when surgery is planned the strategy should be not only resection of the epileptogenic lesion but also lesion surrounding area identified by Epinets. RS-fMRI shows the extensive area around a lesion much similar to the ECOG recordings showing dynamic spikes which are not created equal and are much larger in area than the ictal zone itself. The ECOG study also concludes that surgical resection of the current zone with failure to remove the potential zone can lead to recurrence. Although identification of potential zone may be difficult, by doing a follow-up RS-fMRI the tendency to normalize in the postoperative period carries a good prognosis.[2] [3] [4] PET studies have shown that areas of extensive hypometabolism in extratemporal foci resulted in surgical failures and may indicate the persistent connection of the epileptic zone with the rest of the involved network areas.[21] If an RS-fMRI–PET study is done, it acts as a guide to plan area of resection and monitoring. In a study on RS-fMRI, if the activations were nonlateralizing and more generalized networks, vagus nerve stimulator/responsive nerve stimulator was planned rather than surgery.[22]
Compared with EEG, RS-fMRI is easier to acquire and can provide crucial functional in vivo information similar to that obtained by EEG–MRI/PET. With PET having a behavioral correlation and RS-fMRI giving network information, clinical translation of this modality in epilepsy surgery is feasible. RS-fMRI–PET may also be a viable option for cognitive studies by using a methodology of processing RS-fMRI appropriate to the hypothesis. Many analysis tools have been used in RS-fMRI, with ICA having more accuracy and high specificity of 92% to detect epileptogenic foci.[23]
EEG–PET study has shown that gamma oscillations of EEG and PET had a negative correlation very similar to our RS-fMRI–PET study.[24] In trimodality imaging, an EEG cap creates an artifact on PET attenuation correction images and EEG acquisition is labor intensive process. RS-fMRI–PET allows detection of smaller seizure foci with more specificity. An RS-fMRI–GABA PET can help correlate network neurotransmitter information.
In summary, this study revealed a few important findings. The yield of finding Epinets is more during the postictal period (seizures 3–6 hours before scan) than in the interictal period (seizure-free period). Although PET in these cases did not show visual ictal changes and was reported similar to other interictal PET, RS-fMRI showed far more changes. The overlap between large-scale and downstream networks was noted, indicating that epilepsy propagation can involve cognition networks and cause cognitive dysfunction in epilepsy. Residual Epinets analysis can act as a searchlight in surgical failures and a pre- and postoperative RS-fMRI assessment may be helpful. Shorter and faster acquisition of RS-fMRI very similar to EEG is possible with multiband sequence, and with robust data-driven techniques, ICA can be classified for clinical translation.
Conflict of Interest
None declared.
Acknowledgment
We thank Ankit Sharma, MTech student observer from CCT, Jaipur, who assisted in the data processing.
-
References
- 1 Zijlmans M, Zweiphenning W, van Klink N. Changing concepts in presurgical assessment for epilepsy surgery. Nat Rev Neurol 2019; 15 (10) 594-606
- 2 Boerwinkle VL, Mohanty D, Foldes ST. et al. Correlating resting-state functional magnetic resonance imaging connectivity by independent component analysis-based epileptogenic zones with intracranial electroencephalogram localized seizure onset zones and surgical outcomes in prospective pediatric intractable epilepsy study. Brain Connect 2017; 7 (07) 424-442
- 3 Boerwinkle VL, Cediel EG, Mirea L. et al. Network-targeted approach and postoperative resting-state functional magnetic resonance imaging are associated with seizure outcome. Ann Neurol 2019; 86 (03) 344-356
- 4 Boerwinkle VL, Foldes ST, Torrisi SJ. et al. Subcentimeter epilepsy surgery targets by resting state functional magnetic resonance imaging can improve outcomes in hypothalamic hamartoma. Epilepsia 2018; 59 (12) 2284-2295
- 5 Boerwinkle VL, Vedantam A, Lam S, Wilfong AA, Curry DJ. Connectivity changes after laser ablation: resting-state fMRI. Epilepsy Res 2018; 142: 156-160
- 6 Amboni M, Tessitore A, Esposito F. et al. Resting-state functional connectivity associated with mild cognitive impairment in Parkinson's disease. J Neurol 2015; 262 (02) 425-434
- 7 Gil F, Padilla N, Soria-Pastor S. et al. Beyond the epileptic focus: functional epileptic networks in focal epilepsy. Cereb Cortex 2020; 30 (04) 2338-2357
- 8 Hunyadi B, Tousseyn S, Mijović B. et al. ICA extracts epileptic sources from fMRI in EEG-negative patients: a retrospective validation study. PLoS One 2013; 8 (11) e78796
- 9 Hunyadi B, Tousseyn S, Dupont P, Van Huffel S, De Vos M, Van Paesschen W. A prospective fMRI-based technique for localising the epileptogenic zone in presurgical evaluation of epilepsy. Neuroimage 2015; 113: 329-339
- 10 Fisher RS, Engel Jr JJ. Definition of the postictal state: when does it start and end?. Epilepsy Behav 2010; 19 (02) 100-104
- 11 Hu Y, Chen X, Gu H, Yang Y. Resting-state glutamate and GABA concentrations predict task-induced deactivation in the default mode network. J Neurosci 2013; 33 (47) 18566-18573
- 12 Tatlidil R. Persistent postictal hyperperfusion demonstrated with PET. Epilepsy Res 2000; 42 (2-3): 83-88
- 13 Storti SF, Del Felice A, Formaggio E. et al. Spatial and temporal EEG-fMRI changes during preictal and postictal phases in a patient with posttraumatic epilepsy. Clin EEG Neurosci 2015; 46 (03) 247-252
- 14 van Houdt PJ, Ossenblok PPW, Colon AJ. et al. Are epilepsy-related fMRI components dependent on the presence of interictal epileptic discharges in scalp EEG?. Brain Topogr 2015; 28 (04) 606-618
- 15 Hayes DJ, Huxtable AG. Interpreting deactivations in neuroimaging. Front Psychol 2012; 3: 27
- 16 Barrington SF, Koutroumanidis M, Agathonikou A. et al. Clinical value of “ictal” FDG-positron emission tomography and the routine use of simultaneous scalp EEG studies in patients with intractable partial epilepsies. Epilepsia 1998; 39 (07) 753-766
- 17 Chassoux F, Artiges E, Semah F. et al. 18F-FDG-PET patterns of surgical success and failure in mesial temporal lobe epilepsy. Neurology 2017; 88 (11) 1045-1053
- 18 Centeno M, Carmichael DW. Network connectivity in epilepsy: resting state fMRI and EEG-fMRI contributions. Front Neurol 2014; 5: 93
- 19 Gohel SR, Biswal BB. Functional integration between brain regions at rest occurs in multiple-frequency bands. Brain Connect 2015; 5 (01) 23-34
- 20 Hwang G, Nair VA, Mathis J. et al. Using low-frequency oscillations to detect temporal lobe epilepsy with machine learning. Brain Connect 2019; 9 (02) 184-193
- 21 Jehi L. The epileptogenic zone: concept and definition. Epilepsy Curr 2018; 18 (01) 12-16
- 22 Boerwinkle VL, Mirea L, Gaillard WD. et al. Resting-state functional MRI connectivity impact on epilepsy surgery plan and surgical candidacy: prospective clinical work. J Neurosurg Pediatr 2020; 20: 1-8 . Epub ahead of print. PMID: 32197251
- 23 Shi Y, Zhang X, Yang CL, Ren JC, Li ZM, Wang Q. A review on epileptic foci localization using resting-state functional magnetic resonance imaging. Math Biosci Eng 2020; 17 (03) 2496-2515
- 24 Nishida M, Juhász C, Sood S, Chugani HT, Asano E. Cortical glucose metabolism positively correlates with gamma-oscillations in nonlesional focal epilepsy. Neuroimage 2008; 42 (04) 1275-1284
- 25 Smith SM, Fox PT, Miller KL. et al. Correspondence of the brain's functional architecture during activation and rest. Proc Natl Acad Sci USA 2009; 106 (31) 13040-13045 . PMID: 19620724; PMCID: PMC2722273
Address for correspondence
Publication History
Article published online:
27 March 2023
© 2023. Asian Congress of Neurological Surgeons. This is an open access article published by Thieme under the terms of the Creative Commons Attribution-NonDerivative-NonCommercial License, permitting copying and reproduction so long as the original work is given appropriate credit. Contents may not be used for commercial purposes, or adapted, remixed, transformed or built upon. (https://creativecommons.org/licenses/by-nc-nd/4.0/)
Thieme Medical and Scientific Publishers Pvt. Ltd.
A-12, 2nd Floor, Sector 2, Noida-201301 UP, India
-
References
- 1 Zijlmans M, Zweiphenning W, van Klink N. Changing concepts in presurgical assessment for epilepsy surgery. Nat Rev Neurol 2019; 15 (10) 594-606
- 2 Boerwinkle VL, Mohanty D, Foldes ST. et al. Correlating resting-state functional magnetic resonance imaging connectivity by independent component analysis-based epileptogenic zones with intracranial electroencephalogram localized seizure onset zones and surgical outcomes in prospective pediatric intractable epilepsy study. Brain Connect 2017; 7 (07) 424-442
- 3 Boerwinkle VL, Cediel EG, Mirea L. et al. Network-targeted approach and postoperative resting-state functional magnetic resonance imaging are associated with seizure outcome. Ann Neurol 2019; 86 (03) 344-356
- 4 Boerwinkle VL, Foldes ST, Torrisi SJ. et al. Subcentimeter epilepsy surgery targets by resting state functional magnetic resonance imaging can improve outcomes in hypothalamic hamartoma. Epilepsia 2018; 59 (12) 2284-2295
- 5 Boerwinkle VL, Vedantam A, Lam S, Wilfong AA, Curry DJ. Connectivity changes after laser ablation: resting-state fMRI. Epilepsy Res 2018; 142: 156-160
- 6 Amboni M, Tessitore A, Esposito F. et al. Resting-state functional connectivity associated with mild cognitive impairment in Parkinson's disease. J Neurol 2015; 262 (02) 425-434
- 7 Gil F, Padilla N, Soria-Pastor S. et al. Beyond the epileptic focus: functional epileptic networks in focal epilepsy. Cereb Cortex 2020; 30 (04) 2338-2357
- 8 Hunyadi B, Tousseyn S, Mijović B. et al. ICA extracts epileptic sources from fMRI in EEG-negative patients: a retrospective validation study. PLoS One 2013; 8 (11) e78796
- 9 Hunyadi B, Tousseyn S, Dupont P, Van Huffel S, De Vos M, Van Paesschen W. A prospective fMRI-based technique for localising the epileptogenic zone in presurgical evaluation of epilepsy. Neuroimage 2015; 113: 329-339
- 10 Fisher RS, Engel Jr JJ. Definition of the postictal state: when does it start and end?. Epilepsy Behav 2010; 19 (02) 100-104
- 11 Hu Y, Chen X, Gu H, Yang Y. Resting-state glutamate and GABA concentrations predict task-induced deactivation in the default mode network. J Neurosci 2013; 33 (47) 18566-18573
- 12 Tatlidil R. Persistent postictal hyperperfusion demonstrated with PET. Epilepsy Res 2000; 42 (2-3): 83-88
- 13 Storti SF, Del Felice A, Formaggio E. et al. Spatial and temporal EEG-fMRI changes during preictal and postictal phases in a patient with posttraumatic epilepsy. Clin EEG Neurosci 2015; 46 (03) 247-252
- 14 van Houdt PJ, Ossenblok PPW, Colon AJ. et al. Are epilepsy-related fMRI components dependent on the presence of interictal epileptic discharges in scalp EEG?. Brain Topogr 2015; 28 (04) 606-618
- 15 Hayes DJ, Huxtable AG. Interpreting deactivations in neuroimaging. Front Psychol 2012; 3: 27
- 16 Barrington SF, Koutroumanidis M, Agathonikou A. et al. Clinical value of “ictal” FDG-positron emission tomography and the routine use of simultaneous scalp EEG studies in patients with intractable partial epilepsies. Epilepsia 1998; 39 (07) 753-766
- 17 Chassoux F, Artiges E, Semah F. et al. 18F-FDG-PET patterns of surgical success and failure in mesial temporal lobe epilepsy. Neurology 2017; 88 (11) 1045-1053
- 18 Centeno M, Carmichael DW. Network connectivity in epilepsy: resting state fMRI and EEG-fMRI contributions. Front Neurol 2014; 5: 93
- 19 Gohel SR, Biswal BB. Functional integration between brain regions at rest occurs in multiple-frequency bands. Brain Connect 2015; 5 (01) 23-34
- 20 Hwang G, Nair VA, Mathis J. et al. Using low-frequency oscillations to detect temporal lobe epilepsy with machine learning. Brain Connect 2019; 9 (02) 184-193
- 21 Jehi L. The epileptogenic zone: concept and definition. Epilepsy Curr 2018; 18 (01) 12-16
- 22 Boerwinkle VL, Mirea L, Gaillard WD. et al. Resting-state functional MRI connectivity impact on epilepsy surgery plan and surgical candidacy: prospective clinical work. J Neurosurg Pediatr 2020; 20: 1-8 . Epub ahead of print. PMID: 32197251
- 23 Shi Y, Zhang X, Yang CL, Ren JC, Li ZM, Wang Q. A review on epileptic foci localization using resting-state functional magnetic resonance imaging. Math Biosci Eng 2020; 17 (03) 2496-2515
- 24 Nishida M, Juhász C, Sood S, Chugani HT, Asano E. Cortical glucose metabolism positively correlates with gamma-oscillations in nonlesional focal epilepsy. Neuroimage 2008; 42 (04) 1275-1284
- 25 Smith SM, Fox PT, Miller KL. et al. Correspondence of the brain's functional architecture during activation and rest. Proc Natl Acad Sci USA 2009; 106 (31) 13040-13045 . PMID: 19620724; PMCID: PMC2722273