
Subscribe to RSS
DOI: 10.1055/s-0037-1598649
Computed Tomography Measurement of Inferior Turbinate in Asymptomatic Adult
Address for correspondence
Publication History
05 April 2016
28 November 2016
Publication Date:
28 February 2017 (online)


Abstract
Introduction The inferior turbinate (IT) is the most susceptible turbinate to enlargement causing nasal obstruction. The common belief ascribes most of the enlargement of the IT to mucosal elements.
Objective This study aimed to investigate the detailed computed tomography (CT) measurement of the IT in asymptomatic adult by determining the thickness of both the non-bony (mucosa) and bony parts and their relation to nasal air space in different related areas of the nose.
Methods We included in the study paranasal CT scans of 108 individuals (216 IT) that had no paranasal pathology. We acquired axial images with multiplanar reformates to obtain delicate details in coronal and sagittal planes for all subjects. We took separate measurements of the thickness of the medial mucosa, bones, and lateral mucosa of the IT on the anterior and posterior portions of ITs. We also measured the air space of the nasal cavity between the septum and IT anteriorly and posteriorly.
Results The difference in the air space between nasal septum, anterior and posterior ends of IT was extremely statistically significant (P < 0.0001). The thickness of the medial mucosa was extremely significantly more than the lateral mucosa width (P < 0.0001). There was no significant difference in length of IT at both sides (p = 0.5781).
Conclusion The detailed CT measurement of the IT in normal adult is an easy and novel measurement. This study lays the foundation for CT measurement of IT for further work that can describe changes in IT measures after turbinate surgery.
Introduction
At inspiration, the anterior tip of the inferior nasal concha in the region of the internal nasal valve produces up to two-thirds of upper airway resistance.[1]
Of the three nasal turbinates, the inferior turbinate (IT) is the most susceptible to enlargement and assumed to cause nasal obstruction.[2] [3] Up to 20% of the population had chronic nasal obstruction caused by IT hypertrophy.[4]
Common belief ascribes most of the enlargement of the IT to mucosal elements. Fairbanks[5] claimed that it involves the bone as well as the mucosa and disclosed that the IT becomes thicker and spongier and arches further medially into the airway. It is important to note that the IT bone is thicker anteriorly than posteriorly.[6]
A histological study by Berger et al[7] showed that the most commonly enlarged component of the contralateral IT in septal deviation is the bony nasal concha.
To the best of our knowledge, there is no previous study on the computed tomography (CT) IT measurements. The aim of the current study was to describe the measurement and composition of the normal IT by computed tomography (CT) scan comparing the difference measurement of mucosal and bony parts of the IT at its anterior part that could affect nasal valve when enlarged and posterior part at choana in asymptomatic adults. The main objective was also to analyze the nasal airway passages and its comparison with the IT structure in two points: anterior edge and posterior edge of the IT.
Patients and Methods
This study was conducted in otorhinolaryngology and radiodiagnosis departments, during the period between June 2014 and September 2015. We selected all participants from patients referred to CT examination of the head for different etiologies (parotid gland, brain, the mandible, and temperomandibular joint). We conducted a CT examination of the nasal cavity as part of the requested examination or applied additional selected cuts after the initial one.
All participants included were adults that had no nasal pathology after proper history taking and clinical and endoscopic nasal examination and are referred to as normal adults in the current study.
All participants signed an informed written consent to share in the study, after receiving an explanation of its purposes. We excluded from the study subjects under the age of 16 years, patients who underwent previous sinonasal surgery, or patients with sinonasal pathology or trauma.
Without any type of nasal decongestant, all examinations were performed with a 64-slice CT scan (Light speed volume VCT, GE medical system, Milwaukee, WI, USA). The protocol of 64-slice MDCT was performed with a detector width of 0.625 mm, a section width of 1.5 mm, and an interval reconstruction of 0.5 mm.
We performed axial images covering the paranasal sinuses. We examined the patients in the supine position and the beam was parallel to the hard palate. The cuts began from the hard palate to the top of frontal sinus (glabela). We used 130 KV and 150 mA/sec, with a scan time of 1.5 seconds. The window was wide (window widths ∼1300 to 2000 and window levels about -80 to -200). We conducted examinations with a bone window setting of 3000 HU, centered at 300 HU. We used a high resolution algorithm for enhancement of the fine bony details.
We obtained multiplanar reconstructions with delicate detail in coronal and sagittal planes for all subjects at a dedicated post-processing workstation (Advantage Windows Volume share 4.5, GE Medical System, Milwaukee, WI, USA). We inspected films in routine standardized fashion to ensure we would not miss small details.
Measurement of the thickness of the medial non bony layer (mucosa), bones, lateral non bony layer (mucosa) of the IT were taken separately on the anterior and posterior portions of ITs at a place perpendicular to the mucosal surface with the aid of a cursor on the screen of CT. We performed the measurements just before bony part disappearance posteriorly. Anteriorly, we measured the bony part at the level of the first part of middle turbinate and measured the mucosal part at the level of the second part of middle turbinate ([Figs. 1], [2], and[ 3]).

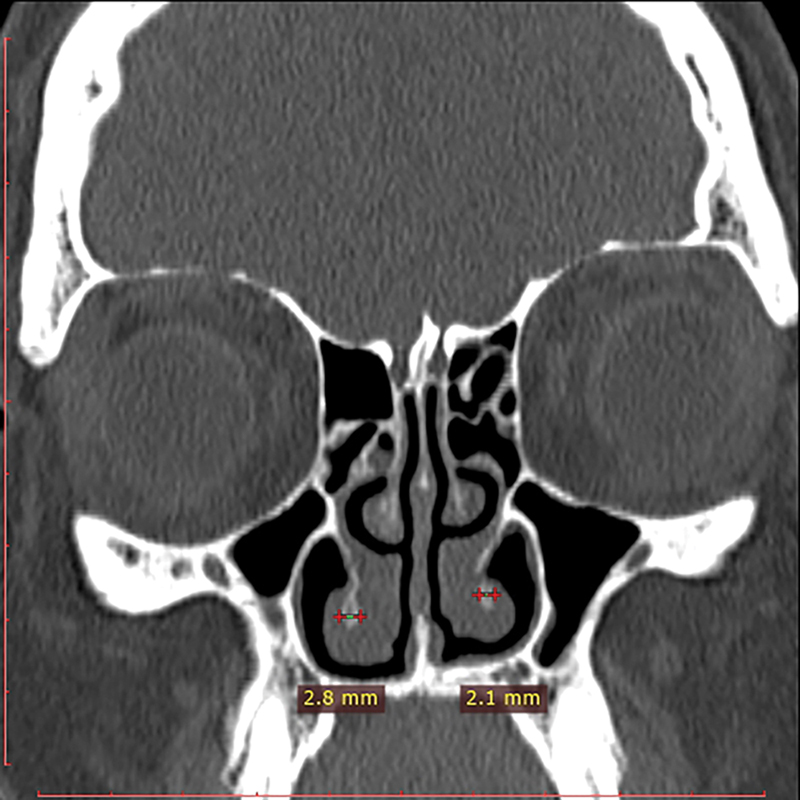

The air space of the nasal cavity was measured between anterior end of the IT and the septum just before appearance of the middle turbinate, then between septum and posterior end at choana. Measurement was taken from the most medial dome of the IT (narrowest airway) ([Fig. 4]). We calculated the anterior posterior length of the IT on both sides on axial CT ([Fig. 5]).


Each of the authors evaluates the CT images on separate sessions, on all views. We then calculated and registered the mean of measured values for each patient.
Results
The current study included 108 subjects (216 ITs): 68 women (63%) and 40 (37%) men. The mean age of included subjects was 31.7 ± 10.5 (range 22- 54).
On the right side, the mean of the airway space between the posterior end of the IT and septum was 3.43 ± 1.6 (range 1.2–7.8 mm), air space was ≥ 4 mm in 40 IT.
On the anterior end, the mean airway space was 2.1 ± 0.8 (range 1- 4.4) air space was ≥ 4 mm in 4 IT. The difference between anterior and posterior air space is statistically significant as p < 0.0001 (t = 7.4488) ([Table 1]).
Abbreviations: HS, highly significant; S, significant.
On the left side, mean of airway space between posterior end of IT and septum was 3.58 ± 1.86 (range 1.1–7.9 mm), air space was ≥ 4 mm in 52 IT.
The mean of the air space at level of anterior end of the IT was 2.5 ± 1.37 (range 1- 4.8). Air space was ≥ 4 mm in 16 IT. So this air space was < 4 mm in 196/216 (90.7%) of both sides at anterior end of IT.
The difference between the air space at level of anterior and posterior end of IT was statistically significant in favor to posterior air way (p < 0.0001, t = 4.6849) ([Table 1]).
On the other hand, on the right side, the mean width of medial non bony part (mucosa) at the anterior end of the IT was 3.2 ± 1.4 (range 1.4–7.4) that significantly wider than the air space (p = 0.0011, t = 7.5386).
Similarly, on the left side, the mean width of medial mucosa at the anterior end of the IT was 3.77 ± 1.4 (range 0.6–5.2) that significantly wider than the air space (p = 0.0021, t = 3.2452).
On the right side, the mean bony width of the anterior end of the IT was 1.05 ± 0.466 (range, 0.3–1.7) that significantly less than medial mucosal width (p < 0.0001, t = 9.4986). On the left side, the mean bony width of the anterior end of the IT was 1.07815 ± 0.52025 (range, 0.4–2.2) that significantly less than medial mucosal width (p < 0.0001, t = 9.2956).
On the right side, the mean lateral non bony part (mucosa) width of the anterior end of the IT was 2.05 ± 0.95975 (range; 0.8–3.4), which is significantly less than medial mucosal width (p = 0.0008; t = 3.5644). On the left side, the mean lateral mucosal width of the anterior end of the IT was 1.88929 ± 1.00456 (range, 0.5- 4.6), which is significantly less than medial mucosal width (p < 0.0001; t = 5.6467).
On the right side, the mean width of medial mucosa at the posterior end of the IT was 5.24 ± 1.655 (range 2.1–8.4), which is significantly wider than the air space (p < 0.0001= 0.0021; t = 8.1713) ([Table 1]). On the left side, the mean width of medial mucosa at the posterior end of the IT was 5 ± 1.63 (range 2.1–7.7), which is significantly wider than the air space (p < 0.0001; t = 5.9669) ([Table 1]).
On the right side, the mean bony width of the posterior end of the IT was 1.24 ± 0.57 (range, 0.5–2.7), which is significantly less than medial mucosal width (p < 0.0001; t = 7.57). On the left side, the mean bony width of the posterior end of the IT was 1.28 ± 0.67 (range, 0.7–2.2), which is significantly less than medial mucosal width (p < 0.0001; t = 21.9284).
On the right side, the mean lateral mucosal width of the posterior end of the IT was 2.39 ± 0.98 (range, 0.6–4.1), which is significantly less than medial mucosal width (p < 0.0001; t = 15.3724). On the left side, the mean lateral mucosal width of the posterior end of the IT was 2.13 ± 0.7 (range, 1- 3.9), which is significantly less than medial mucosal width (p < 0.0001; t = 16.779).
On the left side, the correlation of the medial mucosal width of the posterior end of the IT to IT bony width showed positive correlation (R= 0.4332; R2 = 0.1877), which means there is a tendency for bone width with more mucosal thickness.
On the right side, the correlation of the medial mucosal width of the posterior end of the IT to IT bony width showed moderate positive correlation (R= 0.5733, R2 = 0.3287), which means there is a tendency for bone width with more mucosal thickness.
Whereas, on the anterior end of the IT, this correlation was weak (R = -0.0517; R2 = 0.0027 for left side and R = -0.2077, R2 = 0.0431 for the right side).
With regards to turbinate length, on the right side it ranged from 47.3 to 57.3 mm with a mean of 52.2 ± 3.4 mm. On left side, length of the IT ranged from 44.3 to 59.9 mm with a mean of 51.6 ± 4.1 mm. There was no significant statistical difference in length of both sides (t = 0.5597, p = 0.5781).
Discussion
The ITs anatomically as well as functionally are very important structures that act through their size and position to preserve one of the primary and vital functions of the nose, which is the sufficient nasal breathing. This will be achieved by IT contribution to the normal nasal valve mechanism at the narrowest anterior part of nasal cavity that facilitates the eddy current flow of the air.[8]
CT is a noninvasive technique in assessing the anatomical composition of IT and was used to help in deciding the type of turbinate reduction depending upon the type of hypertrophy,[6] [9] whether mucosal, bony, or both. However, there are no objective measurements or reference to the normal airway size at different areas, and the decision depends on the subjective evaluation of the surgeon.
Evaluation of size of the ITs by CT regarding the thickness of mucosal and bony structures and their relations to the size of the airway space in different areas of the nose is very important before endoscopic assessment of the nose. Moreover, this CT evaluation can answer many questions in the dilemma of IT surgery, particularly regarding the most proper technique, how much is uniquely required to remove from the bulk of hypertrophied IT? Whether IT surgery alone will be sufficient to relieve the mechanical nasal obstruction or a concomitant septoplasty will be required.
Histologically, the IT is composed of three layers: medial and lateral mucosal layers and a central osseous layer between them. The medial layer is considerably thicker than the lateral layer.[8]
In this study, the medial mucosal thickness was mainly responsible for the bulk of the IT, followed by lateral mucosal, and, lastly, bone, with statistically significant differences between them. These results are compatible with the study of Egeli et al[10] that evaluated hypertrophied ITs.
Knowing the type of the predominant tissue of the IT (soft tissue or bone) is important for the selection of the most appropriate technique for each particular patient undergoing IT surgery. Chhabra et al[11] reported that the submucosal diathermy technique proved to be a very effective and simple technique, but was still of no benefit to patients with hypertrophied IT due to the increase in the bulk of conchal bone, rather than soft tissue. While turbinoplasty is the recommended technique for hypertrophied IT due to thickened concha bone, to some extent it can even be performed to reduce IT soft tissue.
In our study, the mean airway space between posterior end of the IT and septum was 3.4 ± 1.6 and 3.59 ± 1.86, while the mean of the same space anteriorly was 2.13 ± 0.8 and 2.5 ± 1.37 at the right and left side, respectively. The difference between anterior and posterior is considered to be extremely statistically significant (p < 0.0001). So the air space at the level of choana is highly significantly wider than the anterior end (nasal valve). This highlights the significant share of the anterior end of IT in nasal resistance by contributing to nasal valve narrowing.
Importantly, these results were compatible with the study by Doorly et al,[12] who reported that the narrowest point of the nasal passage determines the nasal resistance to airflow and this area is referred to as the ‘‘nasal valve” and accounts for up to 50% of total airway resistance in quiet breathing conditions.
At the IT posterior end, mucosa was significantly larger than bone in IT indicating that choanal obstruction by IT hypertrophy is mainly mucosal.
The nasal airway space in this study was less than 4 mm in more than 90% of studied subjects at the nasal valve anteriorly and this explains the need for local decongestant to shrink the turbinate to admit the standard 4 mm diagnostic endoscopy without pain or discomfort to the patients.
To the best of our knowledge, this is the first work to describe the detailed CT measurement of the IT in normal adults. This study highlights the less significant role of the bony part of the IT compared to the mucosa on the air space and, therefore, the air flow. Moreover, the current study puts a base of CT measurement of IT for further studies to describe acoustic rhinometric evaluation to correlate with the observations in differences between anterior and posterior aspects of IT size and airway measurements.
Conclusion
To the best of our knowledge, this is the first work to describe the detailed CT measurements of the IT in normal adults, laying the groundwork for CT measurement of IT for further works that focus on detecting changes in such measures in hypertrophied IT scheduled for surgery and in atrophic rhinitis.
Conflict of Interest Statement
The authors declare no conflict of interest.
-
References
- 1 Haight JS, Cole P. The site and function of the nasal valve. Laryngoscope 1983; 93 (01) 49-55
- 2 Lai VW, Corey JP. The objective assessment of nasal patency. Ear Nose Throat J 1993; 72 (06) 395-396 , 399–400
- 3 Li KK, Powell NB, Riley RW, Troell RJ, Guilleminault C. Radiofrequency volumetric tissue reduction for treatment of turbinate hypertrophy: a pilot study. Otolaryngol Head Neck Surg 1998; 119 (06) 569-573
- 4 Seeger J, Zenev E, Gundlach P, Stein T, Müller G. Bipolar radiofrequency-induced thermotherapy of turbinate hypertrophy: pilot study and 20 months’ follow-up. Laryngoscope 2003; 113 (01) 130-135
- 5 Fairbanks DN. Snoring: surgical vs. nonsurgical management. Laryngoscope 1984; 94 (09) 1188-1192
- 6 Proetz AW. Physiology of the nose from the standpoint of the plastic surgeon. Arch Otolaryngol 1994; 39 (06) 514-517
- 7 Berger G, Hammel I, Berger R, Avraham S, Ophir D. Histopathology of the inferior turbinate with compensatory hypertrophy in patients with deviated nasal septum. Laryngoscope 2000; 110 (12) 2100-2105
- 8 Gindros G, Kantas I, Balatsouras DG, Kandiloros D, Manthos AK, Kaidoglou A. Mucosal changes in chronic hypertrophic rhinitis after surgical turbinate reduction. Eur Arch Otorhinolaryngol 2009; 266 (09) 1409-1416
- 9 Mrig S, Agarwal AK, Passey JC. Preoperative computed tomographic evaluation of inferior turbinate hypertrophy and its role in deciding surgical treatment modality in patients with deviated nasal septum. Int J Morphol 2009; 27 (02) 503-506
- 10 Egeli E, Demirci L, Yazýcý B, Harputluoglu U. Evaluation of the inferior turbinate in patients with deviated nasal septum by using computed tomography. Laryngoscope 2004; 114 (01) 113-117
- 11 Chhabra N, Houser SM. The surgical management of allergic rhinitis. Otolaryngol Clin North Am 2011; 44 (03) 779-795 , xi
- 12 Doorly DJ, Taylor DJ, Schroter RC. Mechanics of airflow in the human nasal airways. Respir Physiol Neurobiol 2008; 163 (1-3): 100-110
Address for correspondence
-
References
- 1 Haight JS, Cole P. The site and function of the nasal valve. Laryngoscope 1983; 93 (01) 49-55
- 2 Lai VW, Corey JP. The objective assessment of nasal patency. Ear Nose Throat J 1993; 72 (06) 395-396 , 399–400
- 3 Li KK, Powell NB, Riley RW, Troell RJ, Guilleminault C. Radiofrequency volumetric tissue reduction for treatment of turbinate hypertrophy: a pilot study. Otolaryngol Head Neck Surg 1998; 119 (06) 569-573
- 4 Seeger J, Zenev E, Gundlach P, Stein T, Müller G. Bipolar radiofrequency-induced thermotherapy of turbinate hypertrophy: pilot study and 20 months’ follow-up. Laryngoscope 2003; 113 (01) 130-135
- 5 Fairbanks DN. Snoring: surgical vs. nonsurgical management. Laryngoscope 1984; 94 (09) 1188-1192
- 6 Proetz AW. Physiology of the nose from the standpoint of the plastic surgeon. Arch Otolaryngol 1994; 39 (06) 514-517
- 7 Berger G, Hammel I, Berger R, Avraham S, Ophir D. Histopathology of the inferior turbinate with compensatory hypertrophy in patients with deviated nasal septum. Laryngoscope 2000; 110 (12) 2100-2105
- 8 Gindros G, Kantas I, Balatsouras DG, Kandiloros D, Manthos AK, Kaidoglou A. Mucosal changes in chronic hypertrophic rhinitis after surgical turbinate reduction. Eur Arch Otorhinolaryngol 2009; 266 (09) 1409-1416
- 9 Mrig S, Agarwal AK, Passey JC. Preoperative computed tomographic evaluation of inferior turbinate hypertrophy and its role in deciding surgical treatment modality in patients with deviated nasal septum. Int J Morphol 2009; 27 (02) 503-506
- 10 Egeli E, Demirci L, Yazýcý B, Harputluoglu U. Evaluation of the inferior turbinate in patients with deviated nasal septum by using computed tomography. Laryngoscope 2004; 114 (01) 113-117
- 11 Chhabra N, Houser SM. The surgical management of allergic rhinitis. Otolaryngol Clin North Am 2011; 44 (03) 779-795 , xi
- 12 Doorly DJ, Taylor DJ, Schroter RC. Mechanics of airflow in the human nasal airways. Respir Physiol Neurobiol 2008; 163 (1-3): 100-110