

Subscribe to RSS
DOI: 10.1055/a-2706-7473
NMR Chemical Shifts of Common Flavonoids
Authors
Supported by: Dr. Willmar Schwabe -
We thank Dr. Willmar Schwabe GmbH & Co. KG, Germany, for the funding of all authors.

Abstract
We present 1H and 13C nuclear magnetic resonance (NMR) chemical shifts for the most common flavonoids, a class of natural products widely present in the plant kingdom. Our data are acquired in three common NMR solvents: methanol d4, dimethyl sulfoxide d6, and pyridine d5 and may be used as a reference for isolated compounds, for detecting flavonoids within mixtures like plant extracts as shown in an example, as reference data for natural product databases, for refined training of prediction software, and for machine learning in resonance assignment and NMR-based structure elucidation. Solvent- and substitution-induced resonance shifts are discussed.
Abbreviations
Introduction
Flavonoids are a class of natural secondary metabolites that are ubiquitous in plants. Due to this prevalent occurrence, they comprise a certain amount of our daily dietary intake and often also have considerable biological activity as reviewed by Shen et al. [1] and by Kumar and Pandey [2]. The major structural differences among flavonoids are the degree of oxidation and saturation, as well as the myriad possibilities of the substitution pattern like O-/C-glycosylation, prenylation, acylation, sulfatation, etc., and combinations thereof. While the aforementioned structural differences result in over 8000 flavonoids reported in the literature so far [3], all flavonoids share a common structural core system consisting of a 15-carbon skeleton including two aromatic rings linked by a 3-carbon chain, which forms a third ring, resulting in a system of three rings.
The great significance of flavonoids among plant secondary metabolites makes their convenient and rapid identification crucial for food chemists and natural product researchers. In this regard, many methods for a specific analysis are already known, like thin-layer chromatography (TLC) combined with a flavonoid-specific staining or high-performance liquid chromatography (HPLC) with ultraviolet (UV), (high-resolution) mass spectrometry (HRMS), or nuclear magnetic resonance (NMR) detection [4], [5]. All these methods require large databases of reference compounds of substance-specific assignments. In the case of NMR, some resonance databases such as JEOL CH-NMR-NP [6] and NP-MRD [7] are already available specifically for natural products. However, the chemical shift data presented in these databases are mostly either from measurements in only one solvent or predicted, with predicted data not always matching experimentally acquired data. The great value of the NP-MRD database for natural product researchers is that their own NMR datasets of natural products can be uploaded, which leads to continuous growth and a large repository. This is, however, a double-edged sword, since a large repository leads to potentially too many hits during search prompts and can mislead due to the overwhelming number of structurally similar natural products. Recent strategies to specifically identify flavonoid-based structures aim at characteristic spectroscopic and spectrometric patterns of flavonoid core structural elements to overcome the aforementioned disadvantages of large databases. Summarized analytical data patterns for flavonoids are available for FT-IR and Raman spectroscopy [8], UV spectroscopy [9], and high-resolution mass spectrometric fragmentation patterns [10]. Using such analytical data patterns instead of databases, the correct flavonoid structure and possible substituents can be identified very fast, while the fine structure of substituents are left for further analysis, e.g., number and stereochemistry of glycoside moieties. Our aim was to complement these analytical efforts with NMR data, since NMR spectroscopy is the method providing the most accurate structural information. Due to the myriad of known flavonoid scaffolds, we concentrate on a subset of the most common phloroglucinol A-ring-based flavonoids for a fast identification of the flavonoid core structural elements. Furthermore, we present some selected glycosides with resonance shift tendencies induced by glycosylation at the most common positions. The latter are presented in order to potentially identify glycosylation spots, leaving the fine structure of the carbohydrates for further analysis. The amount of compounds adds up to 29 compounds. While a list of NMR chemical shifts of flavonoids already exists in the literature [11], the cited data are not usable by todayʼs standards, since the compounds are acquired on continuous-wave spectrometers using CCl4 as the solvent. In contrast, our data on 1H and 13C resonances are acquired by a modern 600 MHz pulsed-field high-resolution spectrometer in three different commonly used NMR solvents: methanol d4 (polar, protic), dimethyl sulfoxide (DMSO) d6 (polar, aprotic), and pyridine d5 (polar, aromatic). Other solvents frequently used for NMR spectroscopy, like water d2 and chloroform d, were not used since the major share of the flavonoids in our list were poorly soluble in these two solvents. Other solvents like acetonitrile d3, acetone d6, tetrahydrofuran d8, and toluene d8 are less frequently used for analysis of flavonoids or plant extracts and, thus, are not part of our lists. Our data of the core structural elements of flavonoids in combination with resonance shift tendencies for the degree of oxidation and glycosylation spots may be a valuable tool for a fast characterization of flavonoid-based natural products and can serve as a quick reference for food chemists and natural product researchers, following the paradigm of the residual solvent list of Gottlieb et al. [12] and follow-up articles [13], [14], all of which are frequently cited and available as hard copies on desks in almost all NMR laboratories worldwide.
In addition to serving as a quick reference guide, our curated dataset may also support the development and refinement of NMR prediction software [15]. Also, recent advances in machine learning of NMR resonance assignment and structure elucidation may largely benefit from our data. Major challenges for such applications are the match between predicted and experimental data, the accuracy of data needed to differentiate between similar structures, and the availability of sufficient amounts of experimental data that are easily accessible, complete, well-assigned, and parse-able [16]. In this regard, our data may contribute to tackling these difficulties to some extent.
Results
The solubility of isorhamnetin, orientin, and vitexin in methanol d4 was too low to obtain the NMR spectra. Apart from these exceptions, all analyzed flavonoids were soluble in all three solvents used. The NMR resonance data are presented in [Table 1] for 1H chemical shifts and in [Table 2] for 13C chemical shifts.
|
Flavonoid name, sum formula, CAS-No. |
Solvent |
2-H |
3-H |
4-H |
6-H |
8-H |
2′-H |
3′-H |
4′-H |
5′-H |
6′-H |
3-OH |
5-OH |
7-OH |
3′-OH |
4′-OH |
1′′-H |
|---|---|---|---|---|---|---|---|---|---|---|---|---|---|---|---|---|---|
|
apigenin, C15H10O5, 520 – 36 – 5  |
methanol d4 |
6.59 |
6.21 d (2.2) |
6.46 d (2.2) |
7.85 |
6.93 |
6.93 |
7.85 |
|||||||||
|
DMSO d6 |
6.79 |
6.20 d (2.2) |
6.49 d (2.0) |
7.93 m |
6.93 |
6.93 |
7.93 |
12.97 |
10.83 |
10.35 |
|||||||
|
pyridine d5 |
6.93 |
6.76 d (2.2) |
6.83 d (2.0) |
7.94 |
7.23 |
7.23 |
7.94 |
13.80 |
|||||||||
|
apigenin-7-O-glucoside, C21H20O10, 578 – 74 – 5  |
methanol d4 |
6.64 |
6.49 d (2.2) |
6.81 d (2.2) |
7.87 |
6.92 |
6.92 |
7.87 |
5.07 |
||||||||
|
DMSO d6 |
6.87 |
6.45 d (2.2) |
6.83 d (2.2) |
7.95 |
6.93 |
6.93 |
7.95 |
12.98 |
5.07 d (7.4) |
||||||||
|
pyridine d5 |
6.92 |
6.88 d (2.2) |
7.12 d (2.2) |
7.89 |
7.21 |
7.21 |
7.89 |
5.87 d (7.6) |
|||||||||
|
aromadendrin, C15H12O6, 480 – 20 – 6  |
methanol d4 |
4.97 d (11.7) |
4.54 d (11.7) |
5.92 d (2.2) |
5.88 d (2.2) |
7.35 |
6.83 |
6.83 |
7.35 |
||||||||
|
DMSO d6 |
5.04 d (11.4) |
4.57 d (11.3) |
5.90 d (2.2) |
5.85 d (2.0) |
7.31 |
6.78 |
6.78 |
7.31 |
11.91 |
||||||||
|
pyridine d5 |
5.47 d (11.6) |
5.04 d (11.4) |
6.52 d (2.2) |
6.39 d (2.2) |
7.75 |
7.25 |
7.25 |
7.75 |
|||||||||
|
(±)-catechin, C15H14O6, 7295 – 85 – 4  |
methanol d4 |
4.56 d (7.4) |
3.97 |
2.45 ddd (16.1; 8.2; 5.5) |
5.92 d (2.3) |
5.85 d (2.2) |
6.83 d (2.0) |
6.75 d (8.6) |
6.72 dd (8.9; 1.8) |
||||||||
|
DMSO d6 |
4.47 d (7.4) |
3.81 |
2.65 ddd (15.9; 5.4; 8.1) |
5.88 d (2.2) |
5.68 d (2.3) |
6.72 d (2.0) |
6.68 d (8.1) |
6.59 dd (8.3; 2.0) |
4.85 |
9.16 |
8.92 |
8.85 |
8.80 |
||||
|
pyridine d5 |
5.24 d (7.8) |
4.63 |
3.35 ddd (16.0; 8.4; 5.5) |
6.71 d (2.3) |
6.66 d (2.3) |
7.66 d (1.8) |
7.25 d (7.8) |
7.24 dd (8.1; 1.5) |
|||||||||
|
chrysin, C15H10O4, 480 – 40 – 0  |
methanol d4 |
6.73 |
6.22 d (2.2) |
6.48 d (2.2) |
7.98 |
7.56 |
7.58 |
7.56 |
7.98 |
||||||||
|
DMSO d6 |
6.98 |
6.23 d (2.2) |
6.53 d (2.2) |
8.08 |
7.59 |
7.62 |
7.59 |
8.08 |
12.83 |
10.92 |
|||||||
|
pyridine d5 |
7.00 |
6.76 d (2.0) |
6.83 d (2.0) |
7.94 |
7.46 |
7.49 |
7.46 |
7.94 |
13.59 |
13.36 |
|||||||
|
(−)-epicatechin, C15H14O6, 490 – 46 – 0  |
methanol d4 |
4.81 |
4.17 |
2.85 ddd (17.0; 5.1; 2.8) |
5.94 d (2.5) |
5.91 d (2.3) |
6.97 d (2.0) |
6.76 d (8.3) |
6.79 dd (8.1; 1.5) |
||||||||
|
DMSO d6 |
4.73 |
4.00 |
2.47 dd/m (16.3; 4.4) |
5.89 d (2.3) |
5.71 d (2.3) |
6.89 d (1.7) |
6.66 d (8.1) |
6.65 dd (8.3; 1.8) |
4.65 |
9.09 |
8.88 |
8.79 |
8.70 |
||||
|
pyridine d5 |
5.38 |
4.73 |
3.55 |
6.68 d (2.2) |
6.67 d (2.3) |
7.92 d (2.0) |
7.27 d (8.1) |
7.35 dd (8.3; 1.8) |
11.39 |
11.19 |
|||||||
|
(−)-epigallocatechin, C15H14O7, 970 – 74 – 1  |
methanol d4 |
4.75 |
4.16 |
2.73 (ax) |
5.93 d (2.3) |
5.91 d (2.3) |
6.51 |
6.51 m |
|||||||||
|
DMSO d6 |
4.65 |
3.98 |
2.47 (eq) |
5.88 d (2.3) |
5.71 d (2.3) |
6.37 |
6.37 |
4.60 d (4.5) |
9.09 |
8.88 |
8.69 |
7.93 |
|||||
|
pyridine d5 |
5.38 |
4.75 |
3.40 (ax) 3.53 (eq) |
6.67 d (2.3) |
6.64 d (2.0) |
7.47 |
7.47 |
||||||||||
|
eriodictyol, C15H12O6, 552 – 58 – 9  |
methanol d4 |
5.28 dd (12.7; 3.0) |
2.69 |
5.88 d (2.3) |
5.90 d (2.1) |
6.91 d (1.0) |
6.78 |
6.78 |
|||||||||
|
DMSO d6 |
5.36 |
2.67 |
5.87 d (2.2) |
5.88 d (2.2) |
6.87 |
6.74 |
6.74 |
12.14 |
|||||||||
|
pyridine d5 |
5.50 |
2.92 |
6.46 d (2.2) |
6.37 d (2.2) |
7.53 d (2.0) |
7.28 d (8.1) |
7.10 |
12.82 |
|||||||||
|
galangin, C15H10O5, 548 – 83 – 4  |
methanol d4 |
6.19 d (2.2) |
6.41 d (2.0) |
8.19 |
7.49 |
7.44 |
7.49 |
8.19 |
|||||||||
|
DMSO d6 |
6.22 d (2.8) |
6.48 d (3.0) |
8.16 |
7.56 |
7.51 |
7.56 |
8.16 |
9.68 |
12.37 |
10.86 |
|||||||
|
pyridine d5 |
6.76 d (2.0) |
6.84 d (2.0) |
8.51 |
7.52 |
7.44 |
7.52 |
8.51 |
13.20 |
|||||||||
|
(+)-gallocatechin, C15H14O7, 970 – 73 – 0  |
methanol d4 |
4.52 d (7.1) |
3.96 |
2.50 |
5.92 d (2.3) |
5.86 d (2.3) |
6.40 |
6.40 |
|||||||||
|
DMSO d6 |
4.42 d (7.1) |
3.78 |
2.34 |
5.88 d (2.3) |
5.69 d (2.2) |
6.24 |
6.24 |
||||||||||
|
pyridine d5 |
5.28 d (7.3) |
4.67 |
3.35 |
6.70 d (2.2) |
6.65 d (2.2) |
7.27 |
7.27 |
||||||||||
|
geni-stein, C15H10O5, 446 – 72 – 0  |
methanol d4 |
8.04 |
6.21 d (2.2) |
6.33 d (2.2) |
7.36 |
6.84 |
6.84 |
7.36 |
|||||||||
|
DMSO d6 |
8.32 |
6.23 d (2.0) |
6.39 d (2.2) |
7.38 |
6.82 |
6.82 |
7.38 |
12.96 |
10.87 |
9.58 |
|||||||
|
pyridine d5 |
8.14 |
6.76 d (2.0) |
6.67 d (2.2) |
7.73 |
7.29 |
7.29 |
7.73 |
13.70 |
|||||||||
|
isoorientin syn. homoorientin, C21H20O11, 4261 – 42 – 1  |
methanol d4 |
6.55 |
6.49 |
7.37 d (2.3) |
6.90 d (8.3) |
7.38 |
4.90 |
||||||||||
|
DMSO d6 |
6.67 |
6.48 |
7.40 d (2.3) |
6.89 d (8.4) |
7.42 |
13.57 |
4.58 |
||||||||||
|
pyridine d5 |
6.90 |
6.67 |
7.88 d (2.3) |
7.27 d (8.4) |
7.51 |
5.86 d (9.7) |
|||||||||||
|
isorhamnetin, C16H12O7, 480 – 19 – 3  |
methanol d4 |
insoluble |
|||||||||||||||
|
DMSO d6 |
6.2 d (2.0) |
6.48 d (2.2) |
7.76 d (2.2) |
6.94 d (8.6) |
7.69 |
9.43 |
12.47 |
10.76 |
9.73 |
3.85 |
|||||||
|
pyridine d5 |
6.76 d (2.0) |
6.87 d (2.0) |
8.31 d (2.0) |
7.38 d (8.4) |
8.21 |
13.37 |
3.89 |
||||||||||
|
isovitexin, C21H20O11, 4261 – 42 – 1  |
methanol d4 |
6.59 |
6.49 |
7.83 |
6.92 |
6.92 |
7.83 |
4.90 d (8.9) |
|||||||||
|
DMSO d6 |
6.79 |
6.51 |
7.93 |
6.93 |
6.93 |
7.93 |
13.56 |
10.56 |
10.351 |
4.59 d (9.7) |
|||||||
|
pyridine d5 |
6.89 |
6.76 |
7.89 |
7.20 |
7.20 |
7.89 |
14.37 |
12.62 |
5.88 d (9.7) |
||||||||
|
kaempferol, C15H10O6, 520 – 18 – 3  |
methanol d4 |
6.18 d (2.0) |
6.39 d (2.0) |
8.08 |
6.90 |
6.90 |
8.08 |
||||||||||
|
DMSO d6 |
6.19 d (2.0) |
6.44 d (2.2) |
8.05 |
6.93 |
6.93 |
8.05 |
12.48 |
||||||||||
|
pyridine d5 |
6.76 d (2.2) |
6.85 d (2.0) |
8.55 |
7.32 |
7.32 |
8.55 |
|||||||||||
|
luteolin, C15H10O6, 491 – 70 – 3  |
methanol d4 |
6.53 |
6.20 d (2.3) |
6.44 d (2.0) |
7.37 d (1.0) |
6.90 |
7.38 |
||||||||||
|
DMSO d6 |
6.67 |
6.19 d (2.0) |
6.45 d (2.2) |
7.40 d (2.2) |
6.89 d (8.3) |
7.42 |
12.98 |
||||||||||
|
pyridine d5 |
6.95 |
6.74 |
6.74 |
7.92 d (2.3) |
7.29 d (8.4) |
7.56 |
13.81 |
||||||||||
|
myricetin, C15H10O8, 529 – 44 – 2  |
methanol d4 |
6.18 d (2.2) |
6.37 d (2.0) |
7.34 |
7.34 |
||||||||||||
|
DMSO d6 |
6.18 d (2.0) |
6.37 d (2.0) |
7.24 |
7.24 |
12.50 |
||||||||||||
|
pyridine d5 |
6.70 d (2.0) |
6.68 d (2.0) |
8.27 |
8.27 |
13.35 |
||||||||||||
|
naringenin, C15H12O5, 480 – 41 – 1 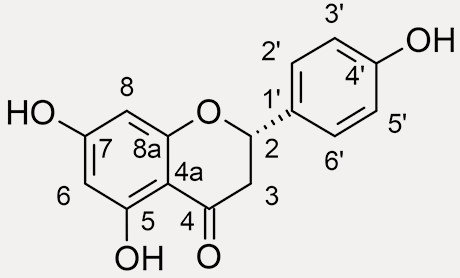 |
methanol d4 |
5.33 |
2.69 |
5.88 d (2.1) |
5.90 d (2.3) |
7.31 |
6.81 |
6.81 |
7.31 |
||||||||
|
DMSO d6 |
5.44 |
2.68 |
5.88 d (2.5) |
5.88 d (2.2) |
7.31 |
6.79 |
6.79 |
7.31 |
12.15 |
10.77 |
9.58 |
||||||
|
pyridine d5 |
5.50 |
2.9 |
6.48 d (2.2) |
6.39 d (2.2) |
7.54 |
7.23 |
7.23 |
7.54 |
12.83 |
||||||||
|
orientin, C21H20O11, 28 608 – 75 – 5  |
methanol d4 |
insoluble |
|||||||||||||||
|
DMSO d6 |
6.65 |
6.27 |
7.48 d (2.0) |
6.86 d (8.4) |
7.53 |
13.17 |
4.68 d (9.9) |
||||||||||
|
pyridine d5 |
6.73 |
6.77 |
8.33 |
7.28 d (8.3) |
7.84 d (7.8) |
13.98 |
5.98 d |
||||||||||
|
orobol, C15H10O6, 480 – 23 – 9  |
methanol d4 |
8.03 |
6.21 d (2.2) |
6.33 d (2.2) |
7.01 d (1.8) |
6.82 d (2.2) |
6.84 |
||||||||||
|
DMSO d6 |
8.27 |
6.19 d (2.2) |
6.35 d (2.0) |
7.00 d (2.0) |
6.77 d (8.3) |
6.80 |
12.99 |
||||||||||
|
pyridine d5 |
8.14 |
6.75 d (2.2) |
6.66 d (2.2) |
7.79 d (2.2) |
7.35 d (8.1) |
7.24 |
|||||||||||
|
quercetin, C15H10O7, 117 – 39 – 5  |
methanol d4 |
6.18 d (2.0) |
6.38 d (2.2) |
7.73 d (2.2) |
6.88 d (8.6) |
7.63 |
|||||||||||
|
DMSO d6 |
6.19 d (2.0) |
6.41 d (2.0) |
7.68 d (2.2) |
6.89 d (8.6) |
7.54 |
12.49 |
|||||||||||
|
pyridine d5 |
6.73 d (2.0) |
6.77 d (2.0) |
8.64 d (2.2) |
7.40 d (8.4) |
8.13 |
13.35 |
|||||||||||
|
quercetin-3-O-galactoside (hyperoside), 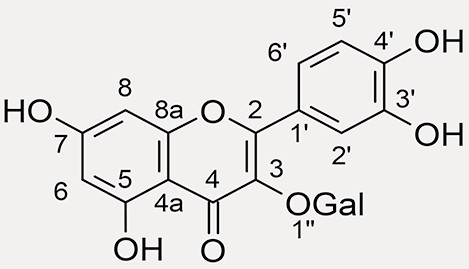 |
methanol d4 |
6.20 d (2.2) |
6.39 d (2.0) |
7.84 d (2.2) |
6.861 d (8.4) |
7.58 |
5.13 d (7.9) |
||||||||||
|
DMSO d6 |
6.20 d (2.0) |
6.40 d (2.0) |
7.53 d (2.3) |
6.82 d (8.4) |
7.67 |
12.63 |
5.38 d (7.8) |
||||||||||
|
pyridine d5 |
6.69 d (2.2) |
6.63 d (2.2) |
8.42 d (2.2) |
7.25 d (8.4) |
8.15 |
13.17 |
6.06 d (7.8) |
||||||||||
|
quercetin-3-O-glucoside (isoquercitrin), C21H20O12, 482 – 35 – 9  |
methanol d4 |
6.20 d (2.0) |
6.39 d (2.2) |
7.71 d (2.3) |
6.87 d (8.4) |
7.58 |
5.25 d (7.8) |
||||||||||
|
DMSO d6 |
6.20 d (2.0) |
6.40 d (2.2) |
7.57 |
6.84 d (9.1) |
7.58 |
12.64 |
5.46 d (7.4) |
||||||||||
|
pyridine d5 |
6.69 d (2.2) |
6.65 d (2.0) |
8.47 d (2.3) |
7.28 d (8.4) |
8.07 |
13.19 |
6.23 d (7.4) |
||||||||||
|
quercetin-4′-O-glucoside (spiraeoside), C21H20O12, 20 229 – 56 – 5  |
methanol d4 |
6.18 d (2.0) |
6.39 d (2.2) |
7.76 d (2.2) |
7.30 d (8.8) |
7.71 |
4.91 d (7.6) |
||||||||||
|
DMSO d6 |
6.20 d (2.0) |
6.45 d (2.0) |
7.70 d (2.3) |
7.25 d (8.8) |
7.62 |
12.42 |
4.85 d (7.4) |
||||||||||
|
pyridine d5 |
6.73 d (2.0) |
6.78 d (2.0) |
8.57 d (2.3) |
7.71 d (8.8) |
8.03 |
13.26 |
5.75 d (7.8) |
||||||||||
|
quercetin-7-O-glucoside (quercimeritrin), C21H20O12, 491 – 50 – 9  |
methanol d4 |
6.45 d (2.2) |
6.74 d (1.8) |
7.75 d (2.2) |
6.88 d (8.6) |
7.66 |
5.05 d (7.4) |
||||||||||
|
DMSO d6 |
6.42 d (2.2) |
6.77 d (2.2) |
7.72 d (2.2) |
6.89 d (8.4) |
7.56 |
5.08 d (7.6) |
|||||||||||
|
pyridine d5 |
6.84 d (2.0) |
7.05 d (2.0) |
8.63 d (2.0) |
7.38 d (8.4) |
8.07 |
5.84 d (7.6) |
|||||||||||
|
quercetin-3-O-glucorhamnoside (rutin), C27H30O16, 153 – 18 – 4  |
methanol d4 |
6.21 d (2.2) |
6.40 d (2.0) |
7.67 d (2.3) |
6.88 d (8.4) |
7.63 |
5.11 d (7.8) |
||||||||||
|
DMSO d6 |
6.19 d (2.2) |
6.38 d (2.2) |
7.53 d (2.2) |
6.84 d (8.3) |
7.54 |
12.60 |
5.34 d (7.4) |
||||||||||
|
pyridine d5 |
6.68 d (2.5) |
6.64 d (2.0) |
8.37 d (2.3) |
7.36 d (8.4) |
8.13 |
6.01 d (2.3) |
|||||||||||
|
taxifolin, C15H12O7, 480 – 18 – 2  |
methanol d4 |
4.91 d (11.6) |
4.50 d (11.4) |
5.92 d (2.2) |
5.88 d (2.2) |
6.96 d (2.2) |
6.80 d (7.9) |
6.84 |
|||||||||
|
DMSO d6 |
4.98 d (11.1) |
4.50 |
5.90 d (2.2) |
5.86 d (2.2) |
6.87 d (1.7) |
6.74 d (7.9) |
6.74 |
5.75 d (6.3) |
11.90 |
10.81 |
9.02 |
8.97 |
|||||
|
pyridine d5 |
5.47 d (11.2) |
5.06 d (11.4) |
6.49 d (2.0) |
6.37 d (2.0) |
7.72 d (1.2) |
7.31 d (8.10) |
7.31 |
12.65 |
|||||||||
|
tricetin, C15H10O7, 520 – 31 – 0  |
methanol d4 |
6.48 |
6.20 d (2.2) |
6.42 d (2.2) |
6.98 |
6.98 |
|||||||||||
|
DMSO d6 |
6.52 |
6.17 d (2.0) |
6.40 d |
6.96 |
6.96 |
||||||||||||
|
pyridine d5 |
6.95 |
6.72 d (1.8) |
6.66 d (1.8) |
7.61 |
7.61 |
||||||||||||
|
vitexin, C21H20O10, 3681 – 93 – 4  |
methanol d4 |
insoluble |
|||||||||||||||
|
DMSO d6 |
6.78 |
6.27 |
8.03 |
6.89 |
6.89 |
8.03 |
13.17 |
10.83 |
10.34 |
4.69 d (9.9) |
|||||||
|
pyridine d5 |
6.74 |
6.79 |
8.33 d (8.3) |
7.26 d (8.8) |
7.26 d (8.8) |
8.33 d (8.3) |
14.01 |
5.98 d (9.7) |
|||||||||
|
Flavonoid name, sum formula, CAS-No. |
Solvent |
2-C |
3-C |
4-C |
4a-C |
5-C |
6-C |
7-C |
8-C |
8a-C |
1′-C |
2′-C |
3′-C |
4′-C |
5′-C |
6′-C |
1′′-C |
|---|---|---|---|---|---|---|---|---|---|---|---|---|---|---|---|---|---|
|
apigenin, C15H10O5, 520 – 36 – 5  |
methanol d4 |
166.3 |
103.9 |
184.0 |
105.3 |
163.3 |
100.2 |
166.2 |
95.1 |
159.5 |
123.3 |
129.5 |
117.1 |
162.8 |
117.1 |
129.5 |
|
|
DMSO d6 |
163.6 |
102.7 |
181.6 |
103.6 |
161.4 |
98.7 |
164.0 |
93.9 |
157.2 |
121.1 |
128.4 |
115.9 |
161.1 |
115.9 |
128.4 |
||
|
pyridine d5 |
164.6 |
104.0 |
182.8 |
105.0 |
163.2 |
100.0 |
165.9 |
94.9 |
158.6 |
122.4 |
129.0 |
116.9 |
162.7 |
116.9 |
129.0 |
||
|
apigenin-7-O-glucoside, C21H20O10, 578 – 74 – 5  |
methanol d4 |
166.9 |
104.1 |
184.1 |
107.1 |
162.9 |
101.2 |
164.9 |
96.1 |
159.0 |
123.0 |
129.7 |
117.2 |
163.2 |
117.2 |
129.7 |
101.7 |
|
DMSO d6 |
164.2 |
102.9 |
181.9 |
105.2 |
161.0 |
99.4 |
162.8 |
94.7 |
156.8 |
120.6 |
128.5 |
115.9 |
161.6 |
115.9 |
128.5 |
99.8 |
|
|
pyridine d5 |
165.0 |
104.0 |
182.9 |
106.6 |
162.7 |
100.7 |
164.1 |
95.3 |
157.9 |
121.9 |
129.0 |
117.0 |
163.2 |
117.0 |
129.0 |
101.8 |
|
|
aromadendrin, C15H12O6, 480 – 20 – 6  |
methanol d4 |
85.0 |
73.7 |
198.5 |
101.9 |
165.4 |
97.4 |
168.8 |
96.3 |
164.6 |
129.3 |
130.4 |
116.2 |
159.3 |
116.2 |
130.4 |
|
|
DMSO d6 |
82.7 |
71.3 |
197.7 |
100.2 |
163.2 |
96.0 |
167.0 |
94.9 |
162.5 |
127.5 |
129.3 |
114.8 |
157.6 |
114.8 |
129.3 |
||
|
pyridine d5 |
84.6 |
73.3 |
198.6 |
101.6 |
165.1 |
97.5 |
169.1 |
96.3 |
163.9 |
128.9 |
130.3 |
116.3 |
159.6 |
116.3 |
130.3 |
||
|
(±)-catechin, C15H14O6, 7295 – 85 – 4  |
methanol d4 |
82.9 |
68.9 |
28.6 |
100.9 |
157.9 |
96.3 |
157.6 |
95.5 |
157.0 |
132.3 |
115.3 |
146.3 |
146.3 |
116.1 |
120.1 |
|
|
DMSO d6 |
80.9 |
66.2 |
27.8 |
98.9 |
156.0 |
95.0 |
156.3 |
93.7 |
155.2 |
130.5 |
114.4 |
144.7 |
144.7 |
114.9 |
118.3 |
||
|
pyridine d5 |
83.5 |
68.4 |
29.9 |
101.2 |
158.6 |
96.8 |
158.9 |
95.7 |
157.5 |
132.4 |
116.3 |
147.3 |
147.3 |
116.5 |
119.9 |
||
|
chrysin, C15H10O4, 480 – 40 – 0  |
methanol d4 |
165.7 |
106.1 |
183.9 |
105.5 |
163.4 |
100.5 |
166.8 |
95.3 |
159.7 |
132.7 |
127.5 |
130.3 |
133.1 |
130.3 |
127.5 |
|
|
DMSO d6 |
163.1 |
105.1 |
181.8 |
103.9 |
161.4 |
98.9 |
164.3 |
94.0 |
157.4 |
130.6 |
126.3 |
129.0 |
131.9 |
129.0 |
126.3 |
||
|
pyridine d5 |
163.8 |
106.2 |
182.8 |
105.2 |
163.2 |
100.2 |
166.2 |
95.0 |
158.6 |
132.0 |
126.8 |
129.4 |
131.8 |
129.4 |
126.8 |
||
|
(−)-epicatechin, C15H14O6, 490 – 46 – 0  |
methanol d4 |
79.9 |
67.5 |
29.3 |
100.1 |
158.1 |
96.4 |
157.7 |
95.9 |
157.4 |
132.3 |
115.4 |
146.0 |
145.8 |
115.9 |
119.4 |
|
|
DMSO d6 |
77.9 |
64.8 |
28.1 |
98.4 |
156.4 |
94.9 |
156.1 |
94.0 |
155.7 |
130.5 |
114.8 |
144.3 |
144.4 |
114.6 |
117.8 |
||
|
pyridine d5 |
80.4 |
67.3 |
30.0 |
100.5 |
159.0 |
97.0 |
159.0 |
96.1 |
158.0 |
132.5 |
116.7 |
147.3 |
147.2 |
116.4 |
119.7 |
||
|
(−)-epigallocatechin, C15H14O7, 970 – 74 – 1  |
methanol d4 |
79.9 |
67.6 |
29.2 |
100.1 |
157.7 |
96.4 |
158.0 |
95.9 |
157.4 |
131.6 |
107.0 |
146.7 |
133.7 |
146.7 |
107.0 |
|
|
DMSO d6 |
78.0 |
64.9 |
28.0 |
98.4 |
156.4 |
94.9 |
156.1 |
93.9 |
155.6 |
129.6 |
105.9 |
145.3 |
132.0 |
145.3 |
105.9 |
||
|
pyridine d5 |
80.2 |
67.0 |
29.4 |
100.3 |
158.6 |
96.6 |
158.6 |
95.8 |
157.6 |
131.4 |
107.7 |
147.8 |
134.8 |
147.8 |
107.7 |
||
|
eriodictyol, C15H12O6, 552 – 58 – 9  |
methanol d4 |
80.6 |
44.2 |
197.8 |
103.4 |
165.5 |
97.1 |
168.4 |
96.2 |
164.9 |
131.8 |
114.7 |
146.9 |
146.6 |
116.3 |
119.3 |
|
|
DMSO d6 |
78.3 |
42.0 |
196.2 |
101.7 |
163.4 |
95.6 |
166.5 |
94.8 |
162.8 |
129.3 |
114.2 |
145.1 |
145.6 |
115.2 |
117.8 |
||
|
pyridine d5 |
79.9 |
43.5 |
196.6 |
103.0 |
165.2 |
97.2 |
168.6 |
96.2 |
164.1 |
130.7 |
115.4 |
147.6 |
148.0 |
116.6 |
118.7 |
||
|
galangin, C15H10O5, 548 – 83 – 4  |
methanol d4 |
147.0 |
138.6 |
177.7 |
104.7 |
162.7 |
99.5 |
166.1 |
94.6 |
158.5 |
132.7 |
128.8 |
129.5 |
130.9 |
129.5 |
128.8 |
|
|
DMSO d6 |
145.6 |
137.0 |
176.2 |
103.1 |
160.7 |
98.2 |
164.1 |
93.5 |
156.3 |
130.9 |
127.5 |
128.4 |
129.9 |
128.4 |
127.5 |
||
|
pyridine d5 |
146.3 |
139.3 |
177.7 |
104.6 |
162.5 |
99.4 |
166.0 |
94.4 |
157.7 |
132.5 |
128.4 |
128.8 |
129.9 |
128.8 |
128.4 |
||
|
(+)-gallocatechin,C15H14O7, 970 – 73 – 0  |
methanol d4 |
82.9 |
68.8 |
28.2 |
100.8 |
157.7 |
96.3 |
157.9 |
95.6 |
156.9 |
131.6 |
107.2 |
146.9 |
134.0 |
146.9 |
107.2 |
|
|
DMSO d6 |
81.0 |
66.2 |
27.3 |
98.9 |
156.1 |
94.9 |
156.3 |
93.7 |
155.2 |
129.7 |
105.9 |
145.5 |
132.4 |
145.5 |
105.9 |
||
|
pyridine d5 |
83.4 |
68.2 |
29.2 |
100.9 |
158.4 |
96.6 |
158.7 |
95.5 |
157.3 |
131.6 |
107.6 |
148.0 |
135.1 |
148.0 |
107.6 |
||
|
genistein, C15H10O5, 446 – 72 – 0  |
methanol d4 |
154.8 |
124.8 |
182.3 |
106.3 |
163.9 |
100.2 |
166.0 |
94.8 |
159.8 |
123.4 |
131.4 |
116.3 |
158.9 |
116.3 |
131.4 |
|
|
DMSO d6 |
153.9 |
122.2 |
180.1 |
104.4 |
161.9 |
98.9 |
164.2 |
93.6 |
157.5 |
121.1 |
130.1 |
115.0 |
157.3 |
115.0 |
130.1 |
||
|
pyridine d5 |
153.4 |
123.7 |
181.3 |
105.9 |
163.7 |
100.1 |
166.0 |
94.6 |
158.7 |
122.4 |
131.1 |
116.3 |
159.3 |
116.3 |
131.1 |
||
|
isoorientin syn. homoorientin, C21H20O11, 4261 – 42 – 1  |
methanol d4 |
166.3 |
104.0 |
184.1 |
105.2 |
162.1 |
109.3 |
165.3 |
95.3 |
158.8 |
123.6 |
114.2 |
147.2 |
151.2 |
116.9 |
120.4 |
75.4 |
|
DMSO d6 |
163.5 |
102.7 |
181.8 |
103.3 |
160.6 |
108.8 |
163.1 |
93.4 |
156.1 |
121.3 |
113.2 |
145.6 |
149.6 |
115.9 |
118.9 |
72.9 |
|
|
pyridine d5 |
164.7 |
104.0 |
182.9 |
104.9 |
162.1 |
110.1 |
164.7 |
94.6 |
157.5 |
122.9 |
114.6 |
147.8 |
151.7 |
116.9 |
119.5 |
75.6 |
|
|
isorhamnetin, C16H12O7, 480 – 19 – 3  |
methanol d4 |
insoluble |
|||||||||||||||
|
DMSO d6 |
146.5 |
135.7 |
175.8 |
102.9 |
160.6 |
98.1 |
163.8 |
93.5 |
156.0 |
121.9 |
111.6 |
147.3 |
148.7 |
115.4 |
121.6 |
55.7 |
|
|
pyridine d5 |
147.8 |
138.2 |
177.6 |
104.8 |
162.8 |
99.6 |
165.9 |
94.7 |
157.8 |
124.1 |
112.9 |
148.7 |
150.4 |
116.9 |
123.1 |
56.3 |
|
|
isovitexin, C21H20O11, 4261 – 42 – 1  |
methanol d4 |
166.2 |
103.9 |
184.1 |
105.2 |
162.1 |
109.3 |
165.1 |
95.3 |
158.8 |
123.2 |
129.5 |
117.1 |
162.9 |
117.1 |
129.5 |
75.4 |
|
DMSO d6 |
163.4 |
102.7 |
181.9 |
103.3 |
160.6 |
108.8 |
163.1 |
93.5 |
156.1 |
121.0 |
128.4 |
115.9 |
161.1 |
115.9 |
128.4 |
72.9 |
|
|
pyridine d5 |
164.3 |
103.9 |
182.9 |
104.9 |
162.1 |
110.2 |
164.9 |
94.7 |
157.5 |
122.3 |
128.9 |
116.9 |
162.7 |
116.9 |
128.9 |
75.6 |
|
|
kaempferol, C15H10O6, 520 – 18 – 3  |
methanol d4 |
148.1 |
137.2 |
177.4 |
104.6 |
162.6 |
99.3 |
165.7 |
94.5 |
158.3 |
123.8 |
130.7 |
116.4 |
160.6 |
116.4 |
130.7 |
|
|
DMSO d6 |
146.7 |
135.6 |
175.8 |
102.9 |
160.6 |
98.1 |
163.8 |
93.4 |
156.1 |
121.6 |
129.4 |
115.3 |
159.1 |
115.3 |
129.4 |
||
|
pyridine d5 |
147.6 |
137.9 |
177.4 |
104.5 |
162.5 |
99.3 |
165.6 |
94.4 |
157.5 |
123.4 |
130.6 |
116.4 |
160.8 |
116.4 |
130.6 |
||
|
luteolin, C15H10O6, 491 – 70 – 3  |
methanol d4 |
166.4 |
103.9 |
183.9 |
105.3 |
163.3 |
100.2 |
166.2 |
95.1 |
159.5 |
123.7 |
114.2 |
147.1 |
151.1 |
116.8 |
120.3 |
|
|
DMSO d6 |
163.8 |
102.8 |
181.6 |
103.6 |
161.4 |
98.7 |
164.0 |
93.7 |
157.2 |
121.4 |
113.3 |
145.6 |
149.6 |
115.9 |
118.9 |
||
|
pyridine d5 |
164.9 |
104.0 |
182.8 |
105.0 |
163.2 |
100.0 |
165.8 |
94.8 |
158.5 |
123.0 |
114.7 |
147.8 |
151.7 |
116.9 |
119.6 |
||
|
myricetin, C15H10O8, 529 – 44 – 2  |
methanol d4 |
148.0 |
137.4 |
177.3 |
104.5 |
162.6 |
99.3 |
165.7 |
94.4 |
158.3 |
123.1 |
108.6 |
146.8 |
137.0 |
146.8 |
108.6 |
|
|
DMSO d6 |
146.7 |
135.8 |
175.6 |
102.9 |
160.6 |
98.0 |
163.8 |
93.1 |
156.0 |
120.7 |
107.0 |
145.6 |
135.8 |
145.6 |
107.0 |
||
|
pyridine d5 |
147.9 |
138.1 |
177.2 |
104.4 |
162.4 |
99.1 |
165.5 |
94.2 |
157.4 |
123.0 |
108.8 |
147.9 |
138.2 |
147.9 |
108.8 |
||
|
naringenin, C15H12O5, 480 – 41 – 1 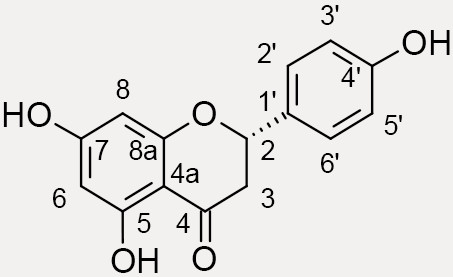 |
methanol d4 |
80.5 |
44.1 |
197.8 |
103.4 |
165.5 |
97.1 |
168.4 |
96.2 |
164.9 |
131.1 |
12 917 |
116.4 |
159.1 |
116.4 |
129.1 |
|
|
DMSO d6 |
78.3 |
41.9 |
196.3 |
101.7 |
163.4 |
95.7 |
166,5 |
94.8 |
162,8 |
128.7 |
128.2 |
115.0 |
157.6 |
115.0 |
128.2 |
||
|
pyridine d5 |
79.7 |
43.3 |
196.5 |
102.9 |
165.2 |
97.3 |
168.6 |
96.2 |
164.1 |
129.8 |
128.9 |
116.5 |
159.6 |
116.5 |
128.9 |
||
|
orientin, C21H20O11, 28 608 – 75 – 5  |
methanol d4 |
insoluble |
|||||||||||||||
|
DMSO d6 |
163.9 |
102.3 |
181.9 |
103.9 |
160.3 |
98.2 |
162.4 |
104.4 |
155.9 |
121.9 |
113.9 |
145.7 |
149.5 |
115.5 |
119.2 |
73.4 |
|
|
pyridine d5 |
165.0 |
103.3 |
183.0 |
105.4 |
162.3 |
99.1 |
164.6 |
106.0 |
157.3 |
123.4 |
115.8 |
147.5 |
151.5 |
117.0 |
120.1 |
75.8 |
|
|
orobol, C15H10O6, 480 – 23 – 9>  |
methanol d4 |
154.8 |
124.9 |
182.3 |
106.3 |
163.9 |
100.3 |
166.3 |
94.9 |
159.8 |
123.9 |
117.5 |
146.3 |
146.9 |
116.4 |
121.7 |
|
|
DMSO d6 |
153.7 |
122.2 |
180.0 |
104.1 |
161.9 |
99.0 |
164.8 |
93.6 |
157.5 |
121.6 |
116.4 |
144.8 |
145.4 |
115.3 |
119.8 |
||
|
pyridine d5 |
153.3 |
123.8 |
181.3 |
105.7 |
163.7 |
100.2 |
166.4 |
94.7 |
158.7 |
123.1 |
117.9 |
147.2 |
147.8 |
116.6 |
121.0 |
||
|
quercetin, C15H10O7, 117 – 39 – 5  |
methanol d4 |
148.0 |
137.3 |
177.4 |
104.6 |
162.6 |
99.3 |
165.7 |
94.5 |
158.3 |
124.2 |
116.0 |
146.3 |
148.8 |
116.3 |
121.7 |
|
|
DMSO d6 |
146.7 |
135.6 |
175.7 |
102.9 |
160.6 |
98.1 |
163.8 |
93.2 |
156.0 |
121.8 |
114.9 |
144.9 |
147.6 |
115.4 |
119.9 |
||
|
pyridine d5 |
147.7 |
137.9 |
177.3 |
104.5 |
162.4 |
99.2 |
165.5 |
94.3 |
157.5 |
123.7 |
116.7 |
147.7 |
149.7 |
116.7 |
121.0 |
||
|
quercetin-3-O-galactoside (hyperoside), C21H20O12, 482 – 36 – 0  |
methanol d4 |
158.8 |
135.8 |
179.6 |
105.6 |
163.1 |
100.1 |
166.6 |
94.9 |
158.5 |
122.9 |
117.8 |
145.9 |
150.0 |
116.1 |
123.0 |
105.5 |
|
DMSO d6 |
156.1 |
133.4 |
177.4 |
103.8 |
161.1 |
98.6 |
164.0 |
93.4 |
156.2 |
121.0 |
115.8 |
144.7 |
148.4 |
115.1 |
121.9 |
101.7 |
|
|
pyridine d5 |
157.9 |
135.6 |
178.9 |
105.2 |
162.7 |
99.8 |
166.0 |
94.6 |
157.6 |
122.4 |
117.8 |
146.8 |
150.8 |
116.3 |
122.9 |
105.6 |
|
|
quercetin-3-O-glucoside (isoquercitrin), C21H20O12, 482 – 35 – 9  |
methanol d4 |
159.1 |
135.7 |
179.5 |
105.7 |
163.1 |
100.0 |
166.1 |
94.8 |
158.5 |
123.1 |
117.6 |
146.0 |
149.9 |
116.0 |
123.2 |
104.3 |
|
DMSO d6 |
156.1 |
133.2 |
177.3 |
103.9 |
161.1 |
98.5 |
164.0 |
93.4 |
156.2 |
121.1 |
116.1 |
144.7 |
148.3 |
115.1 |
121.5 |
100.7 |
|
|
pyridine d5 |
157.7 |
135.6 |
178.8 |
105.2 |
162.8 |
99.8 |
166.0 |
94.6 |
157.6 |
122.4 |
118.0 |
146.8 |
150.7 |
116.3 |
122.6 |
104.5 |
|
|
quercetin-4′-O-glucoside (spiraeoside), C21H20O12, 20 229 – 56 – 5  |
methanol d4 |
146.9 |
138.0 |
177.5 |
104.6 |
162.6 |
99.4 |
165.8 |
94.5 |
158.3 |
127.7 |
116.6 |
148.0 |
148.2 |
117.7 |
121.3 |
103.5 |
|
DMSO d6 |
145.8 |
136.3 |
175.9 |
103.0 |
160.6 |
98.1 |
163.9 |
93.4 |
156.1 |
125.0 |
115.0 |
146.2 |
146.7 |
115.7 |
119.4 |
101.3 |
|
|
pyridine d5 |
146.7 |
138.7 |
177.5 |
104.5 |
162.5 |
99.3 |
165.7 |
94.4 |
157.5 |
127.6 |
117.3 |
148.1 |
149.00 |
117.9 |
120.3 |
103.6 |
|
|
quercetin-7-O-glucoside (quercimeritrin), C21H20O12, 491 – 50 – 9  |
methanol d4 |
148.8 |
137.7 |
177.5 |
106.3 |
162.2 |
100.2 |
164.5 |
95.6 |
157.8 |
124.0 |
116.2 |
146.3 |
149.1 |
116.3 |
121.9 |
101.7 |
|
DMSO d6 |
147.5 |
136.0 |
175.9 |
104.5 |
160.2 |
98.6 |
162.6 |
94.1 |
155.6 |
121.6 |
115.2 |
145.0 |
147.9 |
115.5 |
119.9 |
99.7 |
|
|
pyridine d5 |
148.4 |
138.2 |
177.3 |
106.0 |
161.9 |
99.7 |
163.7 |
94.9 |
156.7 |
123.7 |
116.7 |
147.1 |
149.7 |
116.8 |
121.1 |
101.9 |
|
|
quercetin-3-O-glucorhamnoside (rutin), C27H30O16, 153 – 18 – 4  |
methanol d4 |
159.4 |
135.7 |
179.5 |
105.7 |
163.1 |
100.0 |
166.2 |
94.9 |
158.6 |
123.2 |
117.7 |
145.9 |
149.9 |
116.1 |
123.6 |
104.8 |
|
DMSO d6 |
156.5 |
133.2 |
177.2 |
103.8 |
161.1 |
98.6 |
164.0 |
93.5 |
156.3 |
121.0 |
116.1 |
144.6 |
148.3 |
115.1 |
121.5 |
101.1 |
|
|
pyridine d5 |
158.2 |
135.5 |
178.7 |
105.2 |
162.7 |
99.8 |
166.0 |
94.6 |
157.7 |
122.4 |
118.0 |
146.8 |
150.7 |
116.3 |
122.9 |
105.0 |
|
|
taxifolin, C15H12O7, 480 – 18 – 2  |
methanol d4 |
85.2 |
73.7 |
198.4 |
101.9 |
165.4 |
97.4 |
168.9 |
96.3 |
164.6 |
129.9 |
115.9 |
146.4 |
147.2 |
116.1 |
120.9 |
|
|
DMSO d6 |
82.9 |
71.4 |
197.7 |
100.4 |
163.2 |
95.9 |
166.7 |
94.9 |
162.4 |
127.9 |
115.0 |
144.8 |
145.6 |
115.2 |
119.3 |
||
|
pyridine d5 |
84.9 |
73.3 |
198.8 |
101.7 |
165.2 |
97.4 |
168.7 |
96.2 |
163.9 |
129.6 |
116.7 |
147.4 |
148.1 |
116.4 |
120.3 |
||
|
tricetin, C15H10O7, 520 – 31 – 0  |
methanol d4 |
166.6 |
103.9 |
183.9 |
105.3 |
163.3 |
100.2 |
166.1 |
95.0 |
159.5 |
122.7 |
106.8 |
147.5 |
139.1 |
147.5 |
106.8 |
|
|
DMSO d6 |
164.0 |
102.7 |
181.4 |
103.5 |
161.4 |
98.8 |
164.3 |
93.6 |
157.2 |
120.1 |
105.5 |
146.2 |
138.0 |
146.2 |
105.5 |
||
|
pyridine d5 |
165.2 |
104.1 |
182.8 |
105.0 |
163.2 |
99.9 |
165.8 |
94.7 |
158.5 |
122.1 |
107.1 |
148.4 |
140.4 |
148.4 |
107.1 |
||
|
Vitexin, C21H20O10, 3681 – 93 – 4  |
methanol d4 |
insoluble |
|||||||||||||||
|
DMSO d6 |
163.8 |
102.3 |
182.0 |
103.9 |
160.3 |
98.0 |
162.4 |
104.5 |
155.9 |
121.5 |
128.9 |
115.7 |
161.0 |
115.7 |
128.9 |
73.3 |
|
|
pyridine d5 |
164.9 |
103.3 |
183.0 |
105.4 |
162.3 |
99.2 |
164.6 |
106.2 |
157.4 |
122.6 |
129.7 |
116.9 |
162.7 |
116.9 |
129.7 |
75.6 |
|
Solvent effects on analyte resonances due to magnetic anisotropy, polarity, etc. and the shifting effect of substituents on resonances are commonly known among NMR spectroscopists. Herein, we present these effects on our subset of compounds. Our presented accuracy on a sub-digit scale and the systematics of the analyzed structures may potentially help to increase the accuracy of prediction models. In this regard, comparing the individual flavonoids among the three different solvents ([Table 1]), there is a systematic low-field shift for proton resonances in pyridine d5 of around + 0.0 to + 0.8 ppm compared to both, methanol d4 and DMSO d6. This observation may be attributed to the anisotropic effect of the π ring current of pyridine. In contrast, solvent effects were different for 13C nuclei ([Table 2]): while the aforementioned low field-shifting effect of pyridine is not significantly pronounced, DMSO d6 is systematically shifting the 13C resonances up-field in the order of − 0.5 to − 3.5 ppm. This observation may be attributed to the high dipole moment of DMSO, which may further polarize dipolar groups of the analyte.
Apart from the solvent effect, the substitution pattern of the flavonoids has a significant effect on resonance shifts. Looking at the degree of oxidation (saturation and OH-groups), the least effect is observable for altering patterns of the B-ring, where additional or fewer OH-groups mainly shift resonances of the B-ring itself, leaving the A- and C-rings almost unaffected. In contrast, the presence or absence of the 4-carbonyl-, the 3-OH-group, and/or the 2 – 3-double-bond in the C-ring induces resonance shifts of almost all 13C nuclei within the molecule ([Fig. 1 a]). This effect may be due to the central position of the C-ring within the molecule class, where electron density changes may induce more expansive dipolar moment alterations than in the case of the marginal B-ring.

Apart from the degree of oxidation, C- or O-glycosylation also shifts 13C resonances to a remarkable extent. C-glycosylation shifts the glycosylated carbon resonance up to + 10 ppm compared to the protonated carbon ([Fig. 2 a]). O-glycosylation at the 3-O position shifts C-2 also up to + 10 ppm, while the closer 3-C is shifted up to a lesser extent of ca. − 2 ppm. 4′-O glycosylations have a less pronounced shifting effect of ca. + 4 ppm to − 1 ppm, while 7-O glycosylations have the least effect on carbon shifts in the order of ± 2 ppm ([Fig. 2 b]). The effect on proton shifts is less pronounced for glycosylations (± 0.4 ppm) ([Fig. 2]). Interestingly, resonance shifts are not only observable for nuclei in proximity of the glycosylation spot but also on more distant parts of the flavonoid. This effect may be due to the steric bulk and the multiple OH-groups of carbohydrates, which may form H-bonds to H-bond acceptor/donor groups of the flavonoid. Comparing the effect of three different carbohydrate moieties on quercetin ([Fig. 2 c]) revealed only minor shifts for the flavonoid resonances below 0.1 ppm and 1.0 ppm for 1H and 13C, respectively. Only the resonances of the anomeric group of the carbohydrate are shifted in the order of ± 1.2 ppm. All the aforementioned observations make our list an ideal tool to readily identify the correct flavonoid and the glycosylation spot, while the correct carbohydrate characterization would need further studies.

In general, NMR can be a valuable tool to get insights into compound mixtures like plant extracts [17]. High concentrations of flavonoids may be readily apparent, using NMR signals of the structural core system of flavonoids as clues ([Fig. 3]). Signals that are highly suspicious for flavonoid content comprise the 6-C/H and 8-C/H signals of flavonoids based on phloroglucinol-type A-rings with resonances of 5.5 ppm < δ(1H) < 7.5 ppm and 93 ppm < δ(13C) ≤ 101 ppm. If the concentration of residual water in studied extracts is very low and a water-free aprotic NMR solvent is used, the 5-OH proton of flavonoids containing a 4-carbonyl group can be spotted in the 1D-1H-NMR spectra as an unusually sharp and low field-shifted signal between 11 and 15 ppm, far apart from all other sharp signals of carbon-bound protons. This unusual sharpness and low field shift compared to other aromatic OH groups are due to the adjacent 4-carbonyl oxygen, which is a hydrogen bond acceptor for the 5-OH proton forming a non-covalent six-membered ring ([Fig. 3]). Apart from 5-OH, 6-, and 8-C/H as described above, the 13C resonances of the 4-carbonyl groups may also be used as clues for flavonoids, due to their unusual chemical shift values: while NMR textbooks teach 13C resonances above 200 ppm to be typical for carbonyl groups, in flavonoids the 4-carbonyl groups show resonances below 200 ppm with 190 to 200 ppm for flavanones and flavanonols and 175 to 185 ppm for flavonols, flavones, and isoflavones. Another observation is the large low field shift of ~ 10 ppm for 13C resonances at C-glycosylation spots, like shown for 8-C and 6-C in vitexin/orientin and isovitexin/isoorientin, respectively. In the case of 6-C, C-glycosylation results in resonances of ca. 110 ppm, which is a spectral region less frequently occupied in general and, thus, can also be considered as a clue for isovitexin, isoorientin, and other 6-C-glycosylated flavonoids. However, all aforementioned NMR-based clues for flavonoid content in plant extracts need to be interpreted with caution. This is attributed to other natural products, which may have similar resonances, e.g., indole alkaloids, which also show 1H resonances between 11 and 15 ppm for the nitrogen-bound protons.

In order to test our data as a tool for identifying flavonoids in plant extracts by NMR spectroscopy, we acquired the spectra of a Passiflora incarnata dry extract as an example. Passiflora incarnata is a plant known to be rich in flavonoids, containing quercetin, rutin, apigenin, luteolin, chrysin, vitexin, isovitexin, orientin, and isoorientin as reviewed by Ożarowski and Karpiński [18]. The 1H and 13C NMR spectra of the Passiflora extract were compared with the aforementioned isolated flavonoids ([Fig. 4] and [Fig. 5], respectively). DMSO d6 was chosen as a suitable solvent for these experiments. The other two solvents were not suitable since orientin and vitexin were insoluble in methanol d4 and the Passiflora dry extract was only poorly soluble in pyridine d5.


Comparing the spectra of the Passiflora extract to isolated compounds, offsets of < 0.1 ppm and < 0.3 ppm for 1H and 13C resonances, respectively, are observable for some resonances. These offsets may be due to the lower concentration of the flavonoids in the Passiflora extract compared to the isolated compounds, due to interactions with other compounds in the mixture or due to different pH values of the pure compounds and the Passiflora extract, respectively. In spite of these minor offsets, the dominant flavonoid isovitexin was easily assignable in the extract. The less dominant flavonoids were not that apparent in the spectrum of Passiflora extract, although they are detectable with more sensitive methods like HPLC (data not shown, but they correspond to chromatograms as available in the European pharmacopoeia, Ph. Eur. 11.0: 1882, annex). The absence of signals of lower concentrated compounds is due to the inherently low sensitivity of NMR as a detection method.
Discussion
Parts of the NMR resonance data presented in our tables may be available in the literature, but the researchersʼ efforts for searching and comparing their own experimental data with multiple literature sources may be a time-intensive business. Attempts to identify natural products in mixtures by aligning experimental data with databases using chemometrics software or online databases may overwhelm or mislead due to a potentially very long result list. Another restriction of using these databases is that data are most often only present in one solvent. As shown in our supporting information, potential results of predicted datasets are in some part far from reliable. Thus, our aim was a condensed collection of reliable, experimentally acquired alphanumerical data available to all researchers independent of extensive access to the literature or software. Furthermore, in contrast to data from multiple sources, summarized data are easier for the analysis of effects on resonances due to solvents, the degree of oxidation, and substitution. In this regard, for flavonoids, proton resonances were more prone to shifts due to the ring-current effect of pyridine, while carbon resonances were more prone to shifts induced by the dipolar effect of DMSO. Different degrees of oxidation of the central C-ring significantly alter the resonances of flavonoids. This observation is in accordance with other methods like UV spectroscopy, where the structural alterations of the C-ring also have the most significant effect on the wavelength of the absorption maximum [2]. In contrast, altering numbers of OH-groups in the B-ring only shifts resonances of the B-ring itself, leaving the A- and C-ring resonances almost unaffected. This observation makes our list a valuable tool for reliably identifying the class of flavonoid (flavonol, flavon, flavanonol, flavanon flavanol, or isoflavon), even if the B-ring OH-pattern is not present in our list, e.g., morin (2′- and 4′-OH).
Testing our data on identifying compounds within a plant extract revealed the following limitations of the method:
-
There are minor offsets between a pure compound and the compound in a plant extract mixture in 1H NMR up to 0.1 ppm. The same applies to 13C NMR to an extent of up to 0.3 ppm; however, due to the higher spectral width of 13C NMR, these shifts appear less significant in comparison to 1H NMR. Thus, 13C NMR seems more reliable for the specific identification of compounds within mixtures.
-
Only compounds in major concentrations can be identified due to the inherent low sensitivity of NMR as a detection method. In our example of a Passiflora extract, only the signals of the most dominant flavonoid, isovitexin, had sufficient intensity to stand out from the spectral noise.
-
Our method is not of a conclusive character for unambiguous compound assignment within mixtures due to limitations 1 and 2 described above. It is, rather, suitable as a first insight into plant extracts that have not been studied so far, allowing for predictions on whether they are rich or poor in flavonoids and on which flavonoid class the predominant compounds are based (e.g., flavanone-7-O-glycosides or flavone-6-C-glycosides, etc.).
This first glimpse may largely accelerate specifying suitable successive analysis methods, like specific HPLC, LC-MS, or TLC methods. In contrast, a fully naïve trial-and-error approach without any clues taken from NMR data may take a large amount of time and expendable material until specific compounds are identified.
Another use of our data may be as a reference for researchers who frequently isolate natural products. For isolated compounds, our list may be considered as conclusive since it represents acquired experimental reference data. In this regard, the evidence level is higher than the predicted data from prediction software and databases as shown in our supporting information.
Regarding the plethora of flavonoids known in the literature and databases, our data are not comprehensive by far, lacking, e. g., non-phloroglucinol A-ring-based flavonoids, glycosylations on multiple spots, or other substitutions like prenylation, etc. However, our limited list may cover resonances and glycosylation-induced shifts of the “most common” flavonoid structures found in nature following the Pareto principle: presumably 80% of flavonoid aglycons and glycosylation positions may be identified by our small (“20%”) resonance list in routine analysis. We have selected these 29 flavonoids we consider to be the “most common” due to their structural elements arising from the most basic biosynthesis route of condensation of a phloroglucinol and an unsubstituted or 3-and/or-4(-and-5)-substituted phenylpropanoid. The systematics behind our selection is evident from [Fig. 1] and [Fig. 2]. Considering the effects of the structural elements on the NMR spectra, the degree of oxidation and glycosylation spots have the most significant effect. In contrast, the shifts induced by different carbohydrate moieties are almost nonexistent for the flavonoid resonances, and only the signals of the carbohydrate themselves change. Hence, the flavonoid scaffold and the glycosylation spot of flavonoids can be reliably identified using our data, while the attached carbohydrates would need further characterization.
Researchers are welcome to follow up with systematic data to complete this list with, e.g., non-phloroglucinol A-ring-based flavonoids (e.g., fisetin), prenyl-substitution, glycosylations at two or more spots, etc. Also, experimental NMR data of other non-flavonoid compound classes that contain core structural elements with a manifold substitution pattern, e.g., chalcones, coumarins, monoterpenes, pentacyclic triterpenes, rose ketones, xanthonoids, anthraquinones, lignans, etc., may help researchers obtain a first insight in their studied plant material and accelerate efforts in the training of prediction software and machine learning.
Materials and Methods
NMR spectra were acquired on a Bruker Avance III HD spectrometer with Larmor frequencies of 600 MHz and 150 MHz for 1H and 13C, respectively. Inverse probes, BBI or TCI Cryoprobe Prodigy, were used for all measurements, with a sample temperature of 25 °C and tetramethylsilane as internal reference (1H/13C = 0/0 ppm). The spectra were acquired and processed using Bruker Topspin v3.5pl7 software and analyzed and visualized using ACD/Labs Spectrus Processor v2021.2.0. Sample concentrations were mostly ca. 5 mg of flavonoid in 600 µL of deuterated solvent. The measurement and processing parameters were as described in [Table 3].
|
experiment |
measurement parameters |
processing parameters a |
|||||
|---|---|---|---|---|---|---|---|
|
No. of scans |
spectral width direct [ppm] |
data points |
spectral width indirect [ppm] |
increments |
window function |
parameter for window function |
|
|
a In all 2D experiments apart from HMBC, the specified processing parameters were applied to both dimensions; b Multiplicity-edited HSQC; c For HMBC, the 1/(2 J) delay was using J(CH) = 8 Hz. In rare cases, an additional spectrum using J(CH) = 2 Hz was necessary for reliable assignment; d Magnitude COSY; e NOESY mixing time was 800 ms |
|||||||
|
1D-1H |
32 |
− 1 – 17 |
65 536 |
– |
– |
Euler |
0.3 Hz line broadening |
|
1D-13C |
≥ 4096 |
− 20 – 220 |
65 536 |
– |
– |
Euler |
1.0 Hz line broadening |
|
HSQCed b |
8 |
− 0.5 – 11.5 |
1 730 |
− 5 – 157 |
256 |
sine² |
sine² shift of π/2 |
|
HMBC c |
16 |
− 0.5 – 15.5 |
4 096 |
− 5 – 235 |
256 |
1H: sine² |
sine² shift of π/2 |
|
COSY d |
8 |
− 0.5 – 11.5 |
4 096 |
− 0.5 – 11.5 |
256 |
sine |
sine bell shift of 0 |
|
NOESY e |
16 |
− 0.5 – 11.5 |
2 048 |
− 0.5 – 11.5 |
256 |
sine² |
sine² shift of π/2 |
For resonance assignment, a combination of HSQCed and HMBC was used. In rare cases, COSY was also used. NOESY correlations were used to assign the axial and equatorial 4-protons in the C-ring of flavan-3-ols stereo specifically where possible.
The flavonoid reference compounds were either purchased from common chemical vendors (Sigma Aldrich, Carl Roth, etc.) or were taken from our internal stock from various previous isolations and usually have a purity > 95%. The correct identity of all compounds is directly evident from the resonance-assigned NMR data in the supporting information, with all correlations proving the structures. NMR solvents methanol d4, DMSO d6, and pyridine d5 were purchased from Cortecnet. The Passiflora incarnata L. (Passifloraceae) extract was taken from a pilot production batch (TNCh. 002), which was prepared by a proprietary process using aqueous 60% (v/v) ethanol as extraction solvent. After evaporating the extraction solvent, the dry extract was suspended to a concentration of 27.2 mg in DMSO d6, small amounts of insoluble residues were removed by centrifugation, and the supernatant was used for spectra acquisition. A voucher specimen of the extract was deposited at the site of Dr. Willmar Schwabe GmbH and Co. KG, Germany. The spectra for the extract were acquired with the same instrument, and the parameters were as for the flavonoids above, apart from the 1D 13C NMR spectra, which were acquired with an increased number of scans (120 k scans) due to the low sensitivity of the experiment using inverse detection probes.
Contributorsʼ Statement
Data collection: V. J. N. Steiner, A. Butterer; design of the study: Z. Kulic; analysis and interpretation of the data: V. J. N. Steiner, Z. Kulic; drafting the manuscript: Z. Kulic.
Conflict of Interest
The authors are all employees of Dr. Willmar Schwabe GmbH & Co. KG, Germany. Apart from that, the authors declare that they have no conflict of interest.
Supporting Information
- Supporting Information (PDF) (opens in new window)
The chemical shift data from [Tables 1] and [2] are available in MS Excel format in the Supporting Information. A comparison of our experimental data to the predicted data can also be found in the Supporting Information.
Raw spectral data (Bruker format) can be obtained from the corresponding author upon reasonable request.
-
References
- 1 Shen N, Wang T, Gan Q, Liu S, Wang L, Jin B. Plant flavonoids: Classification, distribution, biosynthesis, and antioxidant activity. Food Chem 2022; 383: 132531
- 2 Kumar S, Pandey AK. Chemistry and biological activities of flavonoids: An overview. Sci World J 2013; 162750
- 3 de Araújo MEMB, Franco YEM, Messias MCF, Longato GB, Pamphile JA, Carvalho PO. Biocatalytic synthesis of flavonoid esters by lipases and their biological benefits. Planta Med 2017; 83: 7-22
- 4 Vukics V, Guttman A. Structural characterization of flavonoid glycosides by multi-stage mass spectrometry. Mass Spectrom Rev 2010; 29: 1-16
- 5 Blunder M, Orthaber A, Bauer R, Bucar F, Kunert O. Efficient identification of flavones, flavanones and their glycosides in routine analysis via off-line combination of sensitive NMR and HPLC experiments. Food Chem 2017; 218: 600-609
- 6 Hayamizu K, Yabe A, Asakura K, Kurimoto T. An open access database for organic natural products “CH-NMR-NP”. 39th Symposium on Chemoinformatics, Hamamatsu. 2016: 8. doi:10.11545/ciqs.2016.0_O8 Database can be found under Accessed May 15, 2025 at: https://ch-nmr-np.jeol.co.jp/en/nmrdb/Accessed 2025. Database can be found under: Accessed May 15, 2025 at: https://ch-nmr-np.jeol.co.jp/en/nmrdb/Accessed
- 7 Wishart DS, Sayeeda Z, Budinski Z, Guo A, Lee BL, Berjanskii M, Rout M, Peters H, Dizon R, Mah R, Torres-Calzada C, Hiebert-Giesbrecht M, Varshavi D, Varshavi D, Oler E, Allen D, Cao X, Gautam V, Maras A, Poynton EF, Tavangar P, Yang V, van Santen JA, Ghosh R, Sarma S, Knutson E, Sullivan V, Jystad AM, Renslow R, Sumner LW, Linington RG, Cort JR. NP-MRD: The natural products magnetic resonance database. Nucleic Acids Res 2022; 50: D665-D677 Database can be found under: Accessed May 15, 2025 at: https://np-mrd.org/Accessed
- 8 Krysa M, Szymańska-Chargot M, Zdunek A. FT-IR and FT-Raman fingerprints of flavonoids – A review. Food Chem 2022; 393: 133430
- 9 Taniguchi M, LaRocca CA, Bernat JD, Lindsey JS. Digital database of absorption spectra of diverse flavonoids enables structural comparisons and quantitative evaluations. J Nat Prod 2023; 86: 1087-1119
- 10 Jiang C, Gates PJ. Systematic characterisation of the fragmentation of flavonoids using high-resolution accurate mass electrospray tandem mass spectrometry. Molecules 2024; 29: 5246
- 11 Mabry TJ, Markham KR, Thomas MB. The systematic identification of flavonoids. Berlin, Heidelberg: Springer; 1970: 274-343
- 12 Gottlieb HE, Kotlyar V, Nudelman A. NMR chemical shifts of common laboratory solvents as trace impurities. J Org Chem 1997; 62: 7512-7515
- 13 Fulmer GR, Miller AJM, Sherden NH, Gottlieb HE, Nudelman A, Stoltz BM, Bercaw JE, Goldberg KI. NMR chemical shifts of trace impurities: common laboratory solvents, organics, and gases in deuterated solvents relevant to the organometallic chemist. Organometallics 2010; 29: 2176-2179
- 14 Babij NR, McCusker EO, Whiteker GT, Canturk B, Choy N, Creemer LC, De Amicis CV, Hewlett NM, Johnson PL, Knobelsdorf JA, Li F, Lorsbach BA, Nugent BM, Ryan SJ, Smith MR, Yang Q. NMR chemical shifts of trace impurities: Industrially preferred solvents used in process and green chemistry. Org Process Res Dev 2016; 20: 661-667
- 15 Jonas E, Kuhn S, Schlörer N. Prediction of chemical shift in NMR: A review. Magn Reson Chem 2021; 60: 1021-1031
- 16 Cortés I, Cuadrado C, Daranas AH, Sarotti AM. Machine learning in computational NMR-aided structural elucidation. Front Nat Prod 2023; 2: 1122426
- 17 Ocampos FMM, de Souza AJB, Ribeiro GH, Almeida LS, Cônsolo NRB, Colnago LA. NMR-based plant metabolomics protocols: A step-by-step guide. Front Nat Prod 2024; 3: 1414506
- 18 Ożarowski M, Karpiński TM. Extracts and flavonoids of Passiflora species as promising anti-inflammatory and antioxidant substances. Curr Pharm Des 2021; 27: 2582-2604
Correspondence
Publication History
Received: 25 May 2025
Accepted after revision: 15 September 2025
Article published online:
29 October 2025
© 2025. The Author(s). This is an open access article published by Thieme under the terms of the Creative Commons Attribution-NonDerivative-NonCommercial License, permitting copying and reproduction so long as the original work is given appropriate credit. Contents may not be used for commecial purposes, or adapted, remixed, transformed or built upon. (https://creativecommons.org/licenses/by-nc-nd/4.0/)
Georg Thieme Verlag KG
Oswald-Hesse-Straße 50, 70469 Stuttgart, Germany
-
References
- 1 Shen N, Wang T, Gan Q, Liu S, Wang L, Jin B. Plant flavonoids: Classification, distribution, biosynthesis, and antioxidant activity. Food Chem 2022; 383: 132531
- 2 Kumar S, Pandey AK. Chemistry and biological activities of flavonoids: An overview. Sci World J 2013; 162750
- 3 de Araújo MEMB, Franco YEM, Messias MCF, Longato GB, Pamphile JA, Carvalho PO. Biocatalytic synthesis of flavonoid esters by lipases and their biological benefits. Planta Med 2017; 83: 7-22
- 4 Vukics V, Guttman A. Structural characterization of flavonoid glycosides by multi-stage mass spectrometry. Mass Spectrom Rev 2010; 29: 1-16
- 5 Blunder M, Orthaber A, Bauer R, Bucar F, Kunert O. Efficient identification of flavones, flavanones and their glycosides in routine analysis via off-line combination of sensitive NMR and HPLC experiments. Food Chem 2017; 218: 600-609
- 6 Hayamizu K, Yabe A, Asakura K, Kurimoto T. An open access database for organic natural products “CH-NMR-NP”. 39th Symposium on Chemoinformatics, Hamamatsu. 2016: 8. doi:10.11545/ciqs.2016.0_O8 Database can be found under Accessed May 15, 2025 at: https://ch-nmr-np.jeol.co.jp/en/nmrdb/Accessed 2025. Database can be found under: Accessed May 15, 2025 at: https://ch-nmr-np.jeol.co.jp/en/nmrdb/Accessed
- 7 Wishart DS, Sayeeda Z, Budinski Z, Guo A, Lee BL, Berjanskii M, Rout M, Peters H, Dizon R, Mah R, Torres-Calzada C, Hiebert-Giesbrecht M, Varshavi D, Varshavi D, Oler E, Allen D, Cao X, Gautam V, Maras A, Poynton EF, Tavangar P, Yang V, van Santen JA, Ghosh R, Sarma S, Knutson E, Sullivan V, Jystad AM, Renslow R, Sumner LW, Linington RG, Cort JR. NP-MRD: The natural products magnetic resonance database. Nucleic Acids Res 2022; 50: D665-D677 Database can be found under: Accessed May 15, 2025 at: https://np-mrd.org/Accessed
- 8 Krysa M, Szymańska-Chargot M, Zdunek A. FT-IR and FT-Raman fingerprints of flavonoids – A review. Food Chem 2022; 393: 133430
- 9 Taniguchi M, LaRocca CA, Bernat JD, Lindsey JS. Digital database of absorption spectra of diverse flavonoids enables structural comparisons and quantitative evaluations. J Nat Prod 2023; 86: 1087-1119
- 10 Jiang C, Gates PJ. Systematic characterisation of the fragmentation of flavonoids using high-resolution accurate mass electrospray tandem mass spectrometry. Molecules 2024; 29: 5246
- 11 Mabry TJ, Markham KR, Thomas MB. The systematic identification of flavonoids. Berlin, Heidelberg: Springer; 1970: 274-343
- 12 Gottlieb HE, Kotlyar V, Nudelman A. NMR chemical shifts of common laboratory solvents as trace impurities. J Org Chem 1997; 62: 7512-7515
- 13 Fulmer GR, Miller AJM, Sherden NH, Gottlieb HE, Nudelman A, Stoltz BM, Bercaw JE, Goldberg KI. NMR chemical shifts of trace impurities: common laboratory solvents, organics, and gases in deuterated solvents relevant to the organometallic chemist. Organometallics 2010; 29: 2176-2179
- 14 Babij NR, McCusker EO, Whiteker GT, Canturk B, Choy N, Creemer LC, De Amicis CV, Hewlett NM, Johnson PL, Knobelsdorf JA, Li F, Lorsbach BA, Nugent BM, Ryan SJ, Smith MR, Yang Q. NMR chemical shifts of trace impurities: Industrially preferred solvents used in process and green chemistry. Org Process Res Dev 2016; 20: 661-667
- 15 Jonas E, Kuhn S, Schlörer N. Prediction of chemical shift in NMR: A review. Magn Reson Chem 2021; 60: 1021-1031
- 16 Cortés I, Cuadrado C, Daranas AH, Sarotti AM. Machine learning in computational NMR-aided structural elucidation. Front Nat Prod 2023; 2: 1122426
- 17 Ocampos FMM, de Souza AJB, Ribeiro GH, Almeida LS, Cônsolo NRB, Colnago LA. NMR-based plant metabolomics protocols: A step-by-step guide. Front Nat Prod 2024; 3: 1414506
- 18 Ożarowski M, Karpiński TM. Extracts and flavonoids of Passiflora species as promising anti-inflammatory and antioxidant substances. Curr Pharm Des 2021; 27: 2582-2604