

Subscribe to RSS
DOI: 10.1055/a-2529-7214
Relating Sustainability Metrics to Evaluate Circularity and Material Efficiency
Authors
Funding Information Funding was provided by the FIT President’s Sustainability Council Grant 2024-25.

Dedication
This work is dedicated to Karen Pearson and the FIT President’s Sustainability Council for their support.
Abstract
By collecting both green chemistry and environmental impact metrics, researchers can quantitatively discuss the circularity and sustainability of various chemical and material products and processes. Specific extensive quantities from a transformation are related to afford intensive properties for a system, which can be compared across systems. Because different metrics are suited for discussing the diverse aspects of sourcing, transformation, and disposal of reactants, reagents, products, and waste, to meaningfully describe both circularity and sustainability, at least three metrics are needed. Here we compare, contrast, and relate the intensive metrics of recycled content, process mass intensity, and e-factor to describe the renewable content of feedstocks, the efficiency of a process, and the cycling of outputs as input feedstocks. Using data from mass balances, we can calculate these metrics in order to have a simple and concise set of tools that describe both the circularity and material efficiency of a process.
Keywords
sustainability - circularity - material efficiency - metrics - intensive and extensive propertiesSustainability metrics help researchers quantify how and why their work is efficient and circular. This communication explores a collection of three metrics that help us holistically evaluate transformations and address the United Nations Sustainable Development Goals (SDG). In this article, SDG #12, Responsible Production and Consumption is explored from two angles: process mass intensity may be used to address process efficiency, while consumption is addressed with the metric recycled content, which can highlight circularity to consumers.
Background
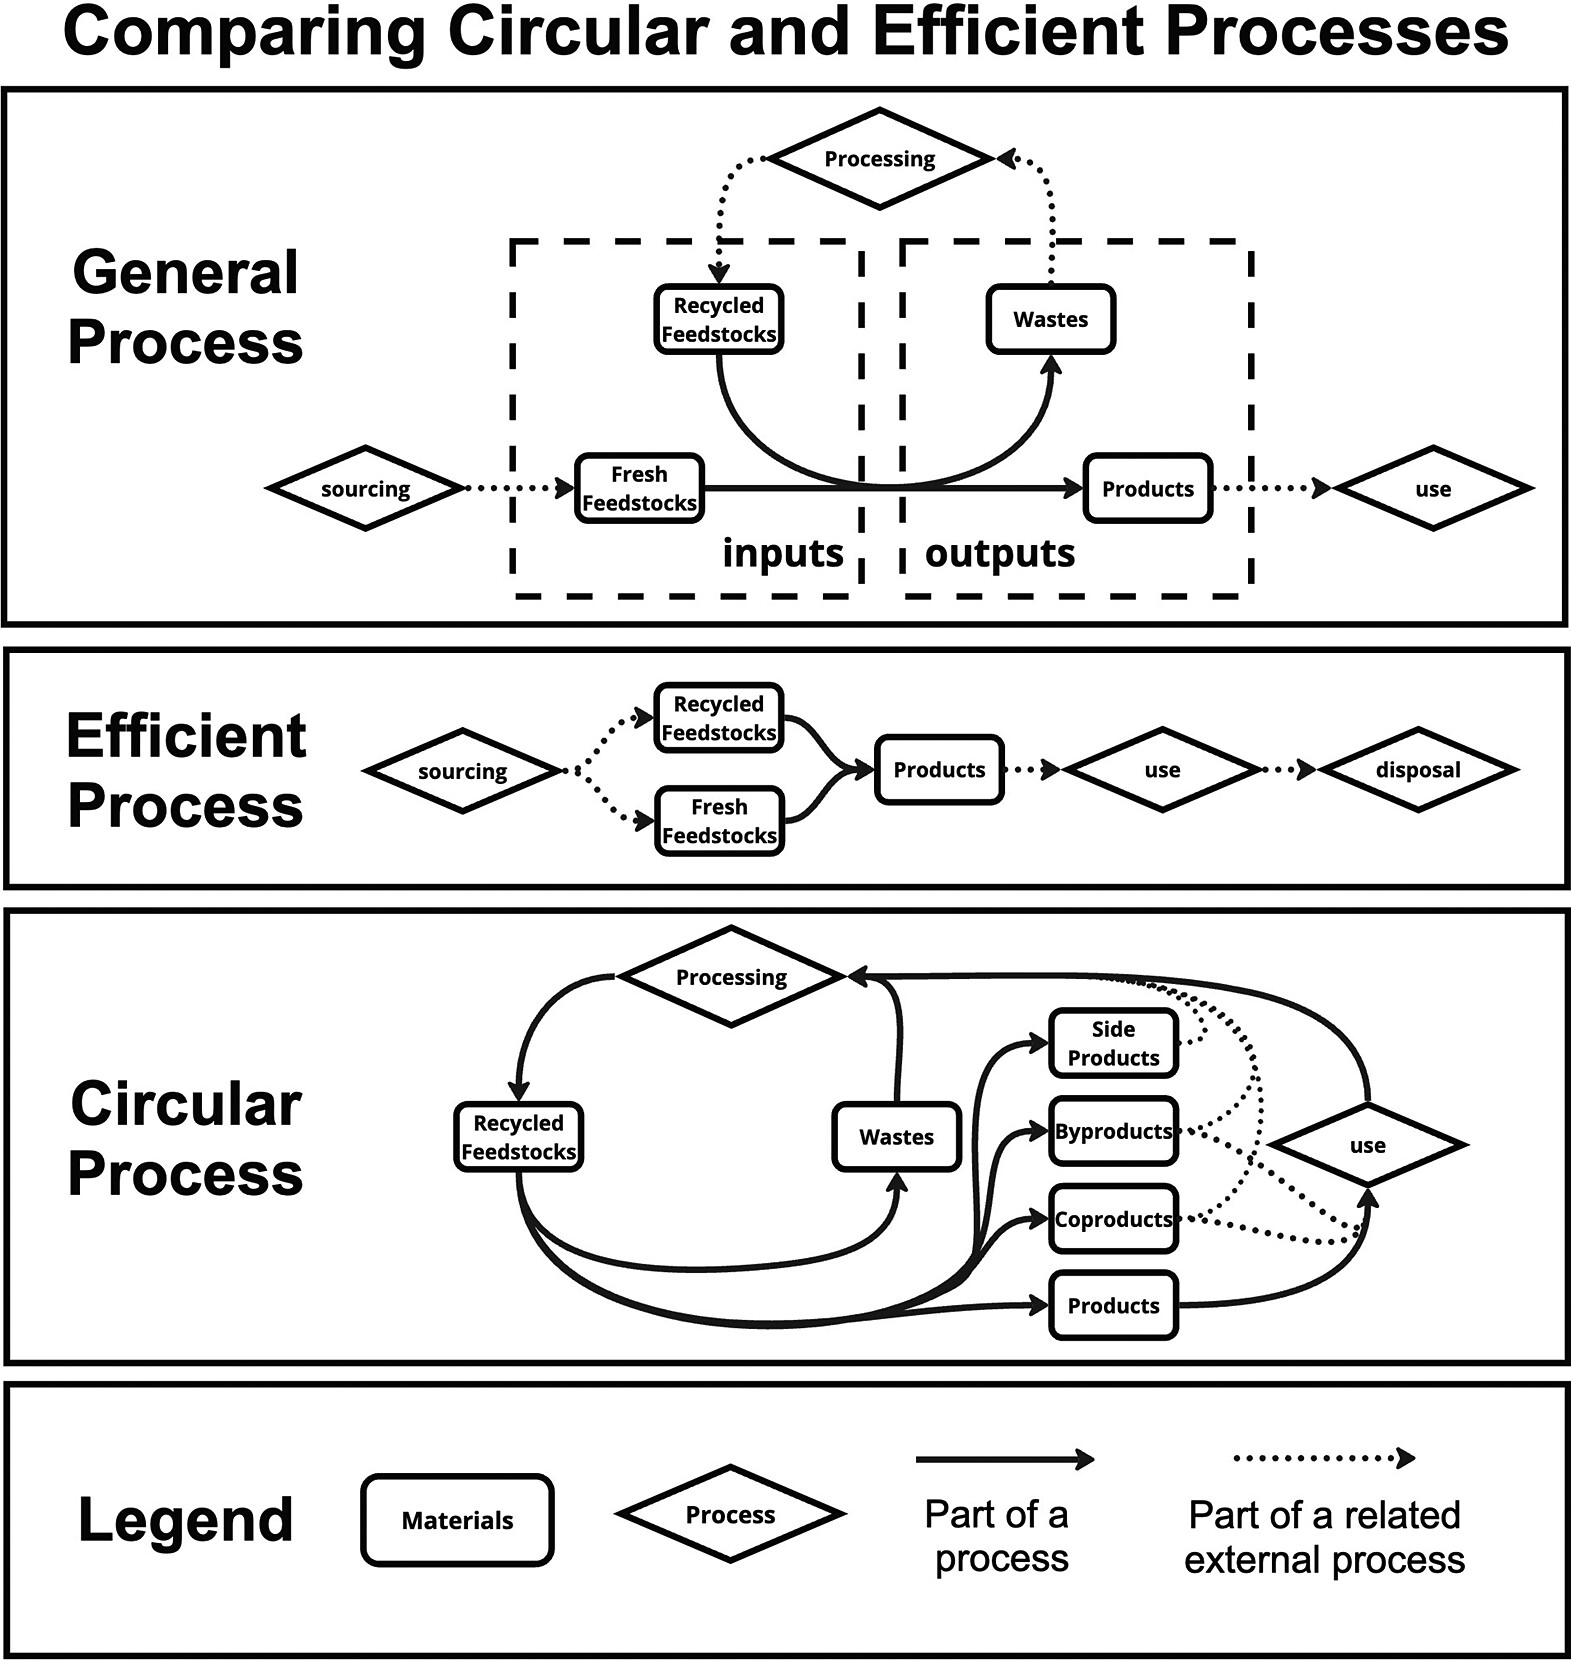
To assess the sustainability of a process, one must evaluate both its material efficiency and its circularity [1], [2]. A process is considered materially efficient if it generates a valuable product with little to no waste ([Figure 1]); [3] on the other hand, a process is considered circular if it uses recycled inputs and recycles outputs as part of a closed loop [4]. Therefore, a materially efficient process may be productive, but not circular. Likewise, a closed-loop process may still be inefficient [5]. Herein, we will review and relate common metrics that are used to evaluate whether a general process is both materially efficient and circular ([Figure 1]). Within this article, for a general process, we will consider the input and output materials and their transformation, but not external considerations and factors such as the related processes including up- and downstream efforts, or sourcing, use, and disposal.
The relationship between changes to inputs and outputs for a general process in a closed system is governed by the law of conservation of mass ([Eq. (1)]).
The mass loss of the inputs is equal to the mass gained by the outputs. The amounts of inputs and outputs are the sum of their parts. Each part’s mass is an extensive property unique to the system [6]. Inputs include chemicals and materials such as reactants, reagents, solvents, and catalysts. Inputs are considered to be either fresh raw materials or content recycled from a related process ([Eq. (2)]).
Outputs include substances such as the main products, coproducts, byproducts, side products, and wastes ([Figure 1] and [Eq. (3)]). Coproducts are expected valuable outputs from a transformation, while byproducts are other lower-value or undesired expected outputs [7]. Side products are outputs formed from competing or side reactions and may be expected but are considered impurities. Byproducts and side products may be processed and recycled and used as input feedstocks for further reactions. Wastes here are defined as anything that is neither a product nor recirculated or recycled.
To evaluate a process, its extensive properties are measured and related. Two extensive properties taken as a ratio form an intensive property, which can be considered independent of a system’s scale [8]. Intensive properties describe the state of the system or a transformation ([Eq. (4)]).
Standard intensive properties are used as metrics to evaluate systems, their states, and their changes, and to compare systems across time and space. Metrics to evaluate material efficiency relate measures before and after a process. Measures to evaluate output efficiency relate to the amounts of desired and undesired outputs. The percent yield of a process is a common intensive metric used to assess reaction efficiency and an intensive property calculated as a ratio of two extensive properties, the amount of obtained product, and the theoretical yield. However, while the percent yield does relate inputs and outputs, it typically only addresses products and does not consider competing factors including competing reactions or side products ([Eq. (5)]).
Therefore, to evaluate a process’s efficiency, we need a metric that holistically relates the inputs and outputs of a process. Furthermore, to evaluate the relative circularity we need two metrics, one for assessing the inputs and the other for assessing the outputs.
To relate products to wastes, inputs, and outputs, distinctive intensive metrics known as E-factor (EF) and process mass intensity (PMI) are used [9], [10]. PMI is determined as the ratio of the masses of the inputs to the masses of the products explicitly relating the inputs and outputs, and the efficiency of a process ([Eq. (6)]).
Focused on the product, compared to yield, PMI includes information about reagents in addition to reactants. EF is determined as the ratio of the masses of the wastes to the masses of the products, and it only addresses the outputs of a reaction ([Eq. (7)]) [11].
EF and PMI are complementary and related, yet even when used together they do not provide meaningful information about the nature of input materials ([Eq. (8)]). EF also provides specific information about wastes, while PMI does not explicitly isolate the waste components.
To address the circularity and efficiency of a process and provide a comprehensive understanding of a process’s material sustainability, a third metric should be used alongside PMI and EF to address feedstock sourcing. An intensive metric frequently reported for consumer products is the recycled content (RC), often reported as a percentage. RC is determined as the ratio of the masses of the recycled inputs to the total mass of the inputs ([Eq. (9)]) [12].
RC exclusively addresses inputs, yet alongside PMI and EF, this set of metrics provides the information we need to assess the circularity and material efficiency of the inputs of a process, their transformation, and outputs for a given system ([Figure 2]). While RC, PMI, and EF address neither energy efficiency nor the hazards of chemical and material components, this set of metrics provides scientists and engineers a meaningful way to evaluate the material sustainability of a process from mass balance data [13], [14].

Case Study: Craft Papermaking
To explore the utility and relationships of the different metrics, three different papermaking processes were evaluated. Craft papermaking can be relatively simple, where a fibrous feedstock is combined with water to generate a pulp, which is then strained, pressed, and dried to make paper that is used for writing, printing, or packaging [16]. Various processes may use fresh or recycled feedstocks, including fibers from agricultural and municipal wastes. These impact the circularity of a process and product. The amounts of paper products and disposed water ultimately determine the efficiency of a process. Together, these considerations contribute to the sustainability of a process. Here, we compare three related yet distinctive papermaking processes to highlight how RC, PMI, and EF may be used to suggest improvements to reduce waste or increase the recycled content.
Three craft paper-making processes were chosen to highlight how lignocellulosic feedstocks may be processed to leverage food and office wastes, in the form of corn husks and recycled paper. The first process upcycles waste corn husks treated with soda ash to create recycled corn husk paper (RCH), the second makes paper from pure cotton fiber (PCF), and the third uses a blend of recycled paper and untreated fresh corn husks for the product paper (PAC) [15] [16] [17]. Though the three procedures produce different amounts of paper product, the RC, PMI, and EF are calculated as ratios that account for the different scales. These metrics are summarized for the three processes in [Table 1]. Raw data and the equations used to generate these metrics are included in the supporting information.
 |
Both the RCH and PCF papers with either recycled or pure fibers have contrasting RCs while the PMI and EF metrics are similar. This shows us the two processes are similarly efficient, as the processes afford the same ratios of product to waste, despite being made from different feedstocks. Comparing the RCH and PAC paper, we find high RC values, denoting circular processes, and similar PMIs, yet the PAC procedure has a much lower and desirable EF, coming from the 90% of the water being recycled after straining. Thus, the PAC process is more efficient. Though the PMI is lower for the RCH process compared to the PAC process, indicating more product per the same amount of inputs, the EF is considerably lower for the PAC process. The RCH process may be improved by including a water recycling step used in the PAC process, which serves to lower the EF.
Similar to a Life Cycle Assessment, these three metrics used together do not serve to identify one best procedure for all scenarios but rather to highlight hotspots or areas of interest that may be adopted across similar procedures [18]. A given context may necessitate more or less recycled content, yet all procedures benefit from a low PMI and low EF. As these metrics are related yet impacted by specific aspects of a procedure (e.g., reagents, reactants, recycling…), they must be used together to assess fundamentally different parts of a chemical or material transformation. The best process is one that combines the circularity of using upcycled materials, and the material efficiency of a high ratio of product to waste to create a more sustainable process. While this broad insight is not novel, by using these metrics together one can target specific inputs or outputs to determine how to reach these goals. Though the best process does not yet exist, it can be fashioned with conclusions drawn when evaluating the metrics of e-factor, recycled content, and process mass efficiency.
Conclusion
Sustainable transformations may be evaluated by identifying low process mass intensity and e-factor and high recycled content processes. To best evaluate materials and processes as efficient and part of a closed loop one must assess, evaluate, and report on the sourcing, transformation, and isolation of products using intensive metrics [19]. Common, accessible, and complementary metrics including recycled content and e-factor address circularity, while process mass intensity addresses efficiency. These may be used collectively to address sustainability from mass balance data. Using these intensive metrics together provides a systematic snapshot of a process that is easily compared and related across boundaries and scales. By collecting these metrics focused on materiality with other complementary metrics focused on energy and toxicity, we can holistically evaluate chemicals, materials, and their transformations.
Contributors’ Statement
Data Collection: A. Marshalek, A. Zion, J. Silverman; Analysis and Interpretation: A. Marshalek, A. Zion, J. Silverman; Drafting Manuscript: A. Marshalek, A. Zion, J. Silverman; Critical Revision: A. Marshalek, A. Zion, J. Silverman.
Conflict of Interest
The authors declare that they have no conflict of interest.
Acknowledgement
Thanks to Dr. Krystal Grieger for proofreading the manuscript. Thanks to the FIT President’s Sustainability Council including its chair Karen Pearson for their help and support. Special thanks to the American Chemical Society Green Chemistry Summer School for the initial introduction to these topics.
Supplementary Material
- Supplementary Material is available at https://doi.org/10.1055/a-2529-7214.
- Supporting Information (PDF) (opens in new window)
-
References
- 1 Lonca G, Muggéo R, Imbeault-Tétreault H, Bernard S, Margni M. Does Material Circularity Rhyme with Environmental Efficiency? Case Studies on Used Tires. J. Cleaner Prod. 2018; 183: 424-435
- 2 Priyadarshini P, Abhilash PC. An Empirical Analysis of Resource Efficiency and Circularity within the Agri-Food Sector of India. J. Cleaner Prod. 2023; 385 135660
- 3 Allwood JM, Ashby MF, Gutowski TG, Worrell E. Material Efficiency: Providing Material Services with Less Material Production. Philos. Trans. R. Soc., A 2013; 371 (1986) 20120496
- 4 García-Barragán JF, Eyckmans J, Rousseau S. Defining and Measuring the Circular Economy: A Mathematical Approach. Ecol. Econ. 2019; 157: 369-372
- 5 Zhang C, Chen W.-Q, Ruth M. Measuring Material Efficiency: A Review of the Historical Evolution of Indicators, Methodologies and Findings. Resour., Conserv. Recycl. 2018; 132: 79-92
- 6 Redlich O. Intensive and Extensive Properties. J. Chem. Educ. 1970; 47 (02) 154
- 7 Watson W. On Byproducts and Side Products. Org. Process Res. Dev. 2012; 16 (12) 1877
- 8 Silverman JR. Exploring Sustainability Metrics in General Chemistry Using Intensive and Extensive Properties of Matter. J. Chem. Educ. 2021; 98 (09) 2741-2745
- 9 Silverman JR, Hudson R. Evaluating Feedstocks, Processes, and Products in the Teaching Laboratory: A Framework for Students To Use Metrics to Design Greener Chemistry Experiments. J. Chem. Educ. 2020; 97 (02) 390-401
- 10 Jimenez-Gonzalez C, Ponder CS, Broxterman QB, Manley JB. Using the Right Green Yardstick: Why Process Mass Intensity Is Used in the Pharmaceutical Industry to Drive More Sustainable Processes. Org. Process Res. Dev. 2011; 15 (04) 912-917
- 11 Sheldon RA. The E Factor at 30: A Passion for Pollution Prevention. Green Chem. 2023; 25 (05) 1704-1728
- 12
International Organization for Standardization.
Environmental Labels and Declarations – Self-Declared Environmental Claims (Type II
Environmental Labeling) (ISO Standard No. 14021:2016 + Amd 1:2021), 2016 https://www.iso.org/standard/66652.html
- 13 Keßler L, Matlin SA, Kümmerer K. The Contribution of Material Circularity to Sustainability—Recycling and Reuse of Textiles. Curr. Opin. Green Sustainable Chem. 2021; 32 100535
- 14 Walker S. Designing Sustainability: Making Radical Changes in a Material World. Routledge; 2014
- 15 Grummer A. Trash-to-Treasure Papermaking: Make Your Own Recycled Paper from Newspapers & Magazines, Can & Bottle Labels, Discarded Gift Wrap, Old Phone Books, Junk Mail, Comic Books, and More. Storey Publishing, LLC; United States: 2011
- 16 Hiebert H. The Papermaker’s Companion: The Ultimate Guide to Making and Using Handmade Paper. Storey Publishing, LLC; United States: 2012
- 17 Facklam M, Phibbs P. Corn-husk Crafts. Sterling; United Kingdom: 1973
- 18 Manda BM. K, Blok K, Patel MK. Innovations in papermaking: An LCA of printing and writing paper from conventional and high yield pulp. Sci. Total Environ. 2012; 439: 307-320
- 19 Subramaniam B, Helling RK, Bode CJ. Quantitative Sustainability Analysis: A Powerful Tool to Develop Resource-Efficient Catalytic Technologies. ACS Sustainable Chem. Eng. 2016; 4 (11) 5859-65
Correspondence
Publication History
Received: 23 September 2024
Accepted after revision: 29 January 2025
Accepted Manuscript online:
30 January 2025
Article published online:
18 February 2025
© 2025. The Author(s). This is an open access article published by Thieme under the terms of the Creative Commons Attribution License, permitting unrestricted use, distribution, and reproduction so long as the original work is properly cited. (https://creativecommons.org/licenses/by/4.0/).
Georg Thieme Verlag KG
Oswald-Hesse-Straße 50, 70469 Stuttgart, Germany
Austin Marshalek, Andie Zion, Julian R. Silverman. Relating Sustainability Metrics to Evaluate Circularity and Material Efficiency. Sustainability & Circularity NOW 2025; 02: a25297214.
DOI: 10.1055/a-2529-7214
-
References
- 1 Lonca G, Muggéo R, Imbeault-Tétreault H, Bernard S, Margni M. Does Material Circularity Rhyme with Environmental Efficiency? Case Studies on Used Tires. J. Cleaner Prod. 2018; 183: 424-435
- 2 Priyadarshini P, Abhilash PC. An Empirical Analysis of Resource Efficiency and Circularity within the Agri-Food Sector of India. J. Cleaner Prod. 2023; 385 135660
- 3 Allwood JM, Ashby MF, Gutowski TG, Worrell E. Material Efficiency: Providing Material Services with Less Material Production. Philos. Trans. R. Soc., A 2013; 371 (1986) 20120496
- 4 García-Barragán JF, Eyckmans J, Rousseau S. Defining and Measuring the Circular Economy: A Mathematical Approach. Ecol. Econ. 2019; 157: 369-372
- 5 Zhang C, Chen W.-Q, Ruth M. Measuring Material Efficiency: A Review of the Historical Evolution of Indicators, Methodologies and Findings. Resour., Conserv. Recycl. 2018; 132: 79-92
- 6 Redlich O. Intensive and Extensive Properties. J. Chem. Educ. 1970; 47 (02) 154
- 7 Watson W. On Byproducts and Side Products. Org. Process Res. Dev. 2012; 16 (12) 1877
- 8 Silverman JR. Exploring Sustainability Metrics in General Chemistry Using Intensive and Extensive Properties of Matter. J. Chem. Educ. 2021; 98 (09) 2741-2745
- 9 Silverman JR, Hudson R. Evaluating Feedstocks, Processes, and Products in the Teaching Laboratory: A Framework for Students To Use Metrics to Design Greener Chemistry Experiments. J. Chem. Educ. 2020; 97 (02) 390-401
- 10 Jimenez-Gonzalez C, Ponder CS, Broxterman QB, Manley JB. Using the Right Green Yardstick: Why Process Mass Intensity Is Used in the Pharmaceutical Industry to Drive More Sustainable Processes. Org. Process Res. Dev. 2011; 15 (04) 912-917
- 11 Sheldon RA. The E Factor at 30: A Passion for Pollution Prevention. Green Chem. 2023; 25 (05) 1704-1728
- 12
International Organization for Standardization.
Environmental Labels and Declarations – Self-Declared Environmental Claims (Type II
Environmental Labeling) (ISO Standard No. 14021:2016 + Amd 1:2021), 2016 https://www.iso.org/standard/66652.html
- 13 Keßler L, Matlin SA, Kümmerer K. The Contribution of Material Circularity to Sustainability—Recycling and Reuse of Textiles. Curr. Opin. Green Sustainable Chem. 2021; 32 100535
- 14 Walker S. Designing Sustainability: Making Radical Changes in a Material World. Routledge; 2014
- 15 Grummer A. Trash-to-Treasure Papermaking: Make Your Own Recycled Paper from Newspapers & Magazines, Can & Bottle Labels, Discarded Gift Wrap, Old Phone Books, Junk Mail, Comic Books, and More. Storey Publishing, LLC; United States: 2011
- 16 Hiebert H. The Papermaker’s Companion: The Ultimate Guide to Making and Using Handmade Paper. Storey Publishing, LLC; United States: 2012
- 17 Facklam M, Phibbs P. Corn-husk Crafts. Sterling; United Kingdom: 1973
- 18 Manda BM. K, Blok K, Patel MK. Innovations in papermaking: An LCA of printing and writing paper from conventional and high yield pulp. Sci. Total Environ. 2012; 439: 307-320
- 19 Subramaniam B, Helling RK, Bode CJ. Quantitative Sustainability Analysis: A Powerful Tool to Develop Resource-Efficient Catalytic Technologies. ACS Sustainable Chem. Eng. 2016; 4 (11) 5859-65