
Subscribe to RSS
DOI: 10.1016/S2213-6320(15)00060-3
Teaching EEG series 2: Mapping the field of spike potential for source localization
Authors
Subject Editor:
Publication History
Publication Date:
08 May 2018 (online)

Questions:
-
Map the field of the spike activity seen in [Fig. 1].
-
Is the field map biologically plausible?
-
Which is the actual source of this spike?

Answers:
-
The discharges appear to have a wide field involving the entire left hemisphere. There is an upward deflection in the left frontal region that can indicate negativity at Fp1. But there is also a downward deflection in the left posterior head region that suggests negativity at O1. Alternatively, there may be a “positive” divergent phase reversal in the left parasagittal chain at C3, meaning amaximumpositivity at C3 and minimal positivity at Fp1 and O1.
-
A large central positivity at C3 would be highly unusual for an epileptiform discharge in the absence of a prior craniotomy and cortical resection exposing the inner surface of the cortical layer.
-
On closer inspection ([Fig. 2]), the divergence at C3 is not truly in phase at the 2 adjacent channels of F3-C3 and C3-P3. Likewise the spike components at Fp1-F3 and P3-O1 are not truly synchronous. Thus, it is not possible to invoke volume conduction from a single source to explain this discharge. The peak occipital negativity at P3-O1 leads the frontal negativity of Fp1-F3 by 30 ms as can be readily appreciated in the Cz referential montage ([Fig. 3]). This indicates that the source of the spike is in the left occipital region with propagation to the left frontal region. This EEG is from a child diagnosed with Panayiotopoulos syndrome and his brain MRI was normal.
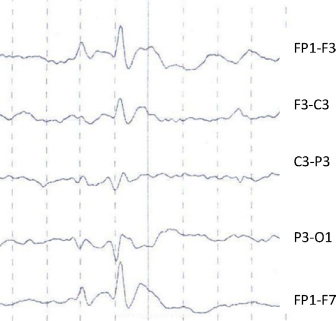

Take home message: Accurate mapping of the field potential prevents erroneous conclusions and permits correct localization of the source. Attention to the time of occurrence of the spike in different regions over the scalp permits one to hypothesize on its source and propagation.
No conflict of interest has been declared by the author(s).
Acknowledgements
We thank Mrs. Elizabeth VT, EEG technician at St. John's Medical College for her assistance and Dr. Sujit Kumar, Consultant Neurologist, Sagar Hospital, Bengaluru for valuable inputs.
-
Reference
- 1 Yoshinaga H, Koutroumanidis M, Kobayashi K, Shirasawa A, Kikumoto K, Inoue T, Oka M, Ohtsuka Y. EEG dipole characteristics in Panayiotopoulos syndrome. Epilepsia 2006; 47 (04) 781-7
-
Reference
- 1 Yoshinaga H, Koutroumanidis M, Kobayashi K, Shirasawa A, Kikumoto K, Inoue T, Oka M, Ohtsuka Y. EEG dipole characteristics in Panayiotopoulos syndrome. Epilepsia 2006; 47 (04) 781-7